3Brief on Bell Shapes
Before expanding the previous Statistical Scenario let's briefly explore why the histogram, reproduced in Figure 3.1, is shaped the way it is: bell-shaped. It tapers off symmetrically on each side from a single peak in the middle.
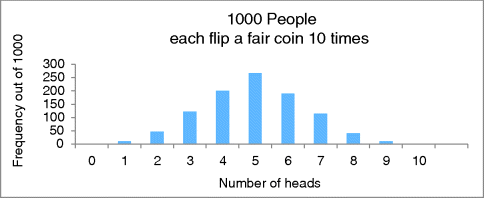
Since each coin flip has two possible outcomes and we are considering ten separate outcomes together, there are a total of ![]() unique possible patterns (permutations) of heads and tails with 10 flips of a coin. Of these, there is only one with 0 heads and only one with 10 heads. These are the least likely outcomes.
unique possible patterns (permutations) of heads and tails with 10 flips of a coin. Of these, there is only one with 0 heads and only one with 10 heads. These are the least likely outcomes.
| TTTTTTTTTT | HHHHHHHHHH |
There are ten with 1 head, and ten with 9 heads:
| HTTTTTTTTT | THHHHHHHHH |
| THTTTTTTTT | HTHHHHHHHH |
| TTHTTTTTTT | HHTHHHHHHH |
| TTTHTTTTTT | HHHTHHHHHH |
| TTTTHTTTTT | HHHHTHHHHH |
| TTTTTHTTTT | HHHHHTHHHH |
| TTTTTTHTTT | HHHHHHTHHH |
| TTTTTTTHTT | HHHHHHHTHH |
| TTTTTTTTHT | HHHHHHHHTH |
| TTTTTTTTTH | HHHHHHHHHT |
Since there are 10 times more ways to get 1 or 9 heads than 0 or 10 heads, we expect to flip 1 or 9 heads 10 times more often than 0 or 10 heads.
Further, there are 45 ways to get 2 or 8 heads, 120 ways to get 3 or 7 heads, and 210 ways to get 4 or 6 heads. Finally, there are 252 ways to get 5 heads, which ...
Get Illuminating Statistical Analysis Using Scenarios and Simulations now with the O’Reilly learning platform.
O’Reilly members experience books, live events, courses curated by job role, and more from O’Reilly and nearly 200 top publishers.

