Chapter 4. Functional comparison 79
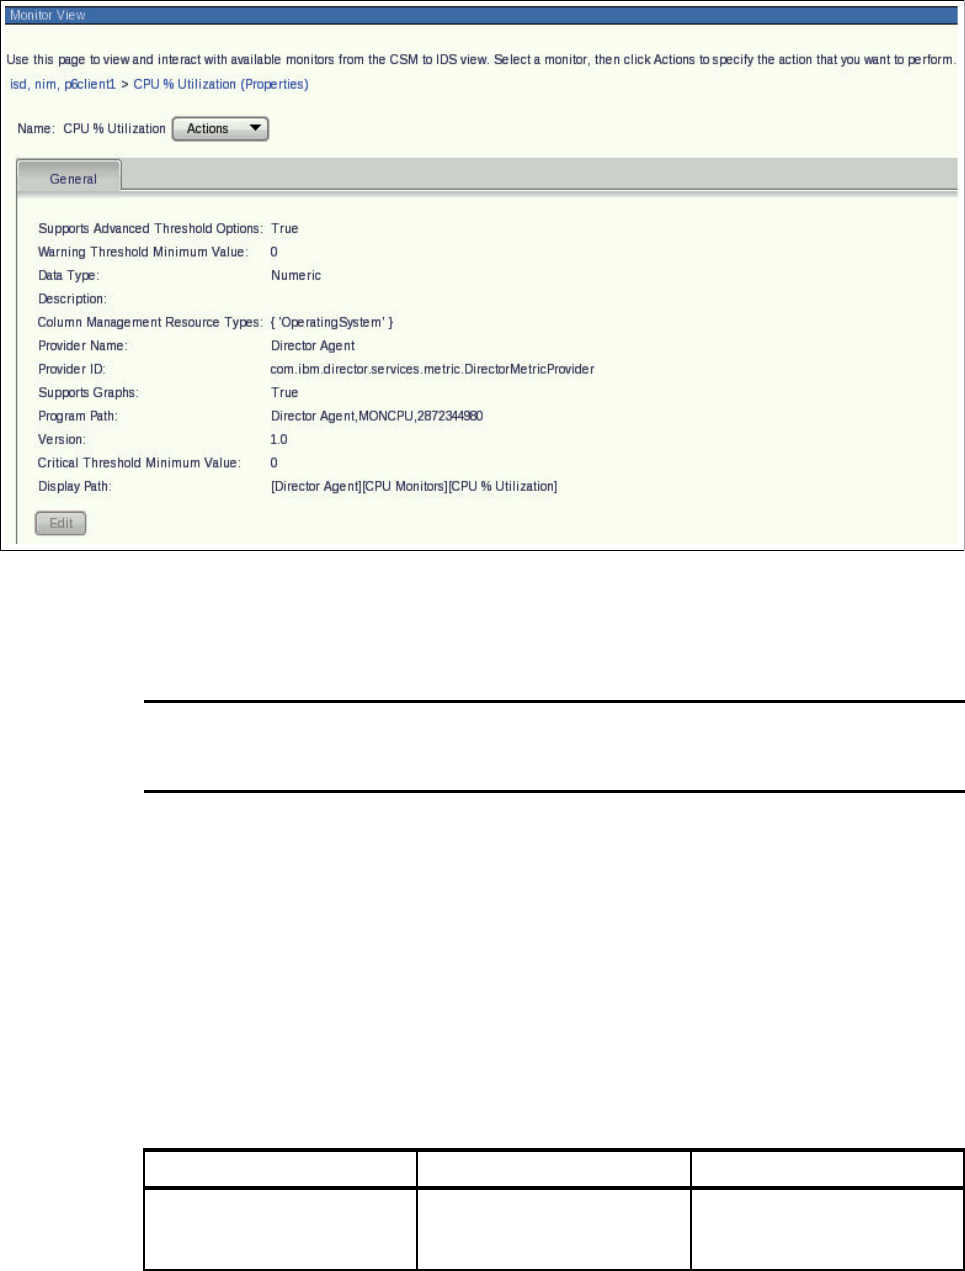
Figure 4-3 Using the Monitor View to list the monitored Object Classes
A similar option is available by using the systems management command line interface
(smcli), as shown in Example 4-1.
Example 4-1 Object class for AIX monitoring of /tmp listed through smcli
[CIM Agent][root/CIMv2][AIX_MetricVal][InstanceID="fs:AvailableSpace:/dev/hd3"]/
[Available Space of Filesystem /tmp
(Megabytes)]
4.2.3 Comparison between various system resource monitors’ output
Since the architectures of CSM and IBM Systems Director are completely different, the option
of reusing existing definitions is considered very limited. We did not find any easy way of
migrating the current CSM monitors to IBM Systems Director.
Where CSM lacked a simplified manageable GUI, Systems Director provides scoreboards,
dashboards, health summarizes and more, easy to manage through a web console. However,
a large portion of the monitoring capabilities is also manageable using smcli. In Table 4-1 we
have mapped the frequently used monitor commands from CSM to the IBM Systems Director
counterpart.
Table 4-1 Mapping between CSM and SDS resource monitoring commands
CSM Commands IBM SDS commands Description
mkconditions runresmon, mkresmonthresh Create and define a resource to
be monitored together with any
threshold values.
80 IBM CSM to IBM Systems Director Transformation Guide
In our CSM-managed cluster we have enabled one of the predefined conditions that create an
event if the total space available on our /tmp file system becomes critical; the output of the
command is shown in Example 4-2.
Example 4-2 Listing a simple file system condition on a CSM managed node
lscondition "/tmp space used"
Displaying condition information:
condition 1:
Name = "/tmp space used"
Node = "p5570lp01"
MonitorStatus = "Monitored"
ResourceClass = "IBM.FileSystem"
EventExpression = "PercentTotUsed > 90"
EventDescription = "An event will be generated when more than i
90 percent of the total space in the /tmp
directory is in use."
RearmExpression = "PercentTotUsed < 75"
RearmDescription = "The event will be rearmed when the percent
of the space used in the /tmp directory
falls below 75 percent."
SelectionString = "Name == \"/tmp\""
Severity = "i"
NodeNames = {}
MgtScope = "l"
Toggle = "Yes"
EventBatchingInterval = 0
EventBatchingMaxEvents = 0
BatchedEventRetentionPeriod = 0
BattchedEventMaxTotalSize = 0
RecordAuditLog = "ALL
"
Creating a similar condition in IBM Systems Director is straightforward. In Figure 4-4 on
page 81, we have created a group view called CSM to IDS, which consists of a small
lsconditions, lscondres,
lsresponse
lsresmon, lsresmonthresh List defined monitors and their
current threshold values.
chcondition chresmonthresh Change the settings of a
resource being monitored.
rmcondition rmresmonthresh Remove a resource monitor
and its thresholds.
mkresponse, mkcondresp mkresmonthresh Create a link between the
resource monitored and the
condition monitored.
startcondresp chresmonthresh -A Start monitoring of a current
resource and/or its threshold.
stopcondresp chresmonthresh -D Stop the monitoring of a current
resource and/or its thresholds.
CSM Commands IBM SDS commands Description

Chapter 4. Functional comparison 81
selection of already discovered systems. In the monitor selection view we selected some of
the predefined AIX Monitors that come with IBM Systems Director.
Figure 4-4 Using the Systems Director web interface to define threshold values
By selecting the Action Menu we can define threshold values, and manage processes and
system properties. In our example we configured CPU Utilization on our NIM server and total
space of file system /tmp on p6client1.
IBM Systems Director also supports the abilities to list monitoring settings and conditions by
using smcli. Hence the format is different from the information provided by RSCT; refer to
Example 4-3.
Example 4-3 Using to lsmcli lsresmon to list active monitored thresholds on managed Using the smcli
lsresmonthres command to list the active monitored thresholds rewrote in blue text
$ smcli lsresmonthresh -l -m "[Director Agent][CPU Monitors][CPU Utilization]" -n nim
Name: Individual threshold for CPU % Utilization on system nim
IsActive: true
Type: Individual
Target: nim
Attribute:[Director Agent][CPU Monitors][CPU Utilization]
Description:
Double Data HighError :90.0 HighWarning :75.0
IBM Systems Director provides another monitor option called process monitoring. In
Figure 4-5 on page 82, we have selected the sshd daemon for monitoring, where the default
process event options issue an event on the following condition criteria, where one or more
apply:
Start
Ter minate
Fail to start after reboot
Tip: Use the lssys command without any options to list all system names, or the lssys -o
command to list all system IDs.
Get IBM CSM to IBM Systems Director Transformation Guide now with the O’Reilly learning platform.
O’Reilly members experience books, live events, courses curated by job role, and more from O’Reilly and nearly 200 top publishers.

