Appendix D
Regression Modeling
Regression models quantify the relationship between two variables. Later, we’ll talk about how multiple variables can get involved and how variables that are “categorical” can be used, but all of those more complex concepts are just extensions of the basics. Exhibit D.1 shows a small data set taken from a performance improvement system, where the employees were rated on a yearly scale. The question is whether the 2008 ratings correlated strongly with the 2009 ratings—in other words, whether high-performing employees continued to perform highly. The following graph shows the two year’s reviews graphed against each other. The pattern seems clear; higher scores in the previous year shows a tendency toward higher scores the next year.
Exhibit D.1 Current Year’s Appraisals as a Function of the Previous Year’s Appraisals
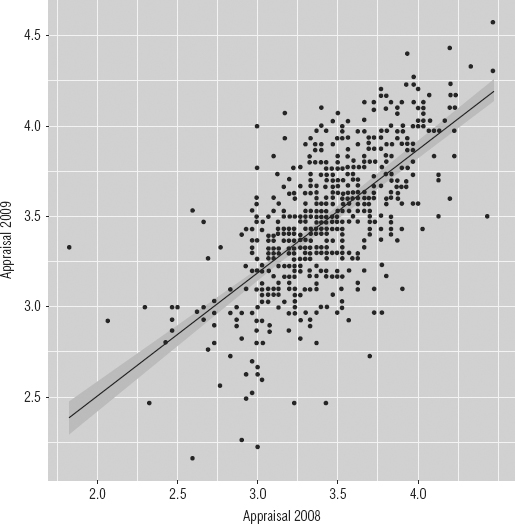
The line that goes through the points looks about right, but how did it get there? The goal of a regression is to minimize the average distance between the line and the points scattered around it. For any regression model, there is exactly one best answer. The equation used in this example is on the chart:
![]()
What, exactly, does that mean? The x-axis is last year’s rating, and the y-axis is this year’s rating. You could write this out as
Get Human Capital Analytics: How to Harness the Potential of Your Organization's Greatest Asset now with the O’Reilly learning platform.
O’Reilly members experience books, live events, courses curated by job role, and more from O’Reilly and nearly 200 top publishers.

