Chapter 1. Canvas for Publishers
With the <canvas> element, publishers now
have the opportunity to embed a dynamic sketchpad into HTML5 content. The
What is HTML5 for
doing so is quite simple:
<canvasid="my_first_canvas"width="200"height="225">The content you put here will show up if your rendering enginedoesn't support the <canvas> element.</canvas>
The <canvas> element accepts two attributes
that specify the dimensions of your drawing area in pixels:
width and height. Anything you place
within the opening and closing tags of the element will only be displayed if
the rendering engine does not support <canvas>;
this gives you the option of providing fallback content for backward
compatibility with non-HTML5 environments (see HTML5 Canvas, EPUB, and Ereader compatibility for more on compatibility).
And that’s where the HTML starts and ends; it merely sets aside the
space within the HTML document in which to place your graphics. To actually
draw on your <canvas>, you’ll use JavaScript code to
interact with the Canvas API, which provides you with an elegant set of
functions for creating lines, arcs, shapes, and text. You also have access
to more advanced graphic-manipulation calls to scale, rotate, or crop your
images.
Drawing on your <canvas>
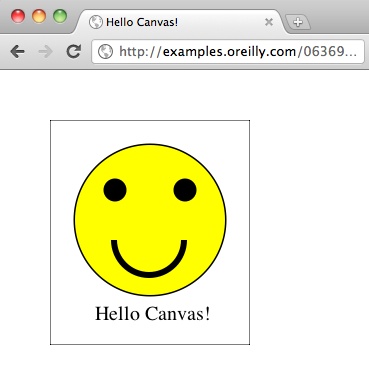
Let’s draw a smiley face on the canvas we just created above. Here’s a list of the Canvas API functions we’ll use:
strokeRect(x1,y1,x2,y2)Draw a rectangular outline from the point (x1, y1) to (x2, y2). Note: by default, the “origin” of the Canvas (0,0) is its top-left corner, and x- and y-coordinates are measured to the right and down, respectively.
beginPath()Start a line drawing.
closePath()End a line drawing that was started with
beginPath().arc(x,y,arc_radius,angle_radians_beg,angle_radians_end)Specify an arc, where (x, y) is the center of the circle encompassing the arc,
arc_radiusis the radius of this circle, andangle_radians_begandangle_radians_endindicate the beginning and end of the arc angle in radians.stroke()Draw the border of the path specified within
beginPath()/closePath(). Note: If you don’t include thestroke()call, your path will not appear on the canvas.fill()Fill in the path specified within
beginPath()/closePath().fillText(your_text,x1,y1)Add text to the canvas, starting at the point (x1, y1).
We’ll also use the following attributes in conjunction with these properties to specify colors and styles:
lineWidthWidth of the border of your path
strokeStyleColor of the border of your path
fillStyleColor of the fill (interior) of your path
fontFont and size of your text
And here’s the code that puts it all together:
functiondrawPicture(){my_canvas.strokeRect(0,0,200,225)// to start, draw a border around the canvas//draw facemy_canvas.beginPath();// circle dimensionsmy_canvas.arc(100,100,75,(Math.PI/180)*0,(Math.PI/180)*360,false);my_canvas.strokeStyle="black";// circle outline is blackmy_canvas.lineWidth=3;// outline is three pixels widemy_canvas.fillStyle="yellow";// fill circle with yellowmy_canvas.stroke();// draw circlemy_canvas.fill();// fill in circlemy_canvas.closePath();// now, draw left eyemy_canvas.fillStyle="black";// switch to black for the fillmy_canvas.beginPath();// circle dimensionsmy_canvas.arc(65,70,10,(Math.PI/180)*0,(Math.PI/180)*360,false);my_canvas.stroke();// draw circlemy_canvas.fill();// fill in circlemy_canvas.closePath();// now, draw right eyemy_canvas.beginPath();// circle dimensionsmy_canvas.arc(135,70,10,(Math.PI/180)*0,(Math.PI/180)*360,false);my_canvas.stroke();// draw circlemy_canvas.fill();// fill in circlemy_canvas.closePath();// draw smilemy_canvas.lineWidth=6;// switch to six pixels wide for outlinemy_canvas.beginPath();// semicircle dimensionsmy_canvas.arc(99,120,35,(Math.PI/180)*0,(Math.PI/180)*-180,false);my_canvas.stroke();my_canvas.closePath();// Smiley Speaks!my_canvas.fillStyle="black";// switch to black for text fillmy_canvas.font='20px _sans';// use 20 pixel sans serif fontmy_canvas.fillText("Hello Canvas!",45,200);// write text}
Figure 1-1 shows the image displayed in the Safari Web browser. You can load this example in your browser, or take a look at the source code in GitHub.
If the functionality of the HTML5 Canvas were limited to the display
of static images, however, its appeal would likely be quite limited. Who
wants to write all that JavaScript code, when you can easily to add images
to an HTML document the old-school way—with an <img>
tag!
But all that JavaScript is exactly what makes Canvas so powerful and
feature-rich. Because you can directly manipulate the artwork with code,
you can dynamically update what’s displayed on the
<canvas> in real time, and in response to user
input. Instead of an inert smiley face, you can have a smiley face that
winks every 18 seconds, or a smiley face that frowns when you click on it.
The possibilities are endless: from games and jigsaw
puzzles, to undulating
photo galleries and molecular
modeling.
Next, we’ll look at a couple of HTML5 Canvas examples that can be used to enhance ebook content: a graphing calculator for linear algebraic equations, and a children’s finger painting app.
Canvas Graphing Calculator
Most first-year algebra curricula contain a unit on graphing on the Cartesian coordinate plane. Many students initially have some difficulty grasping the concept of representing algebraic equations visually, as it’s a real paradigm shift from traditional arithmetic. Graphing calculators, both hardware and software, are helpful tools in the teaching process, as they allow learners to quickly and efficiently experiment with plotting equations, so they can understand how changes made in an equation affect the shape of the graph.
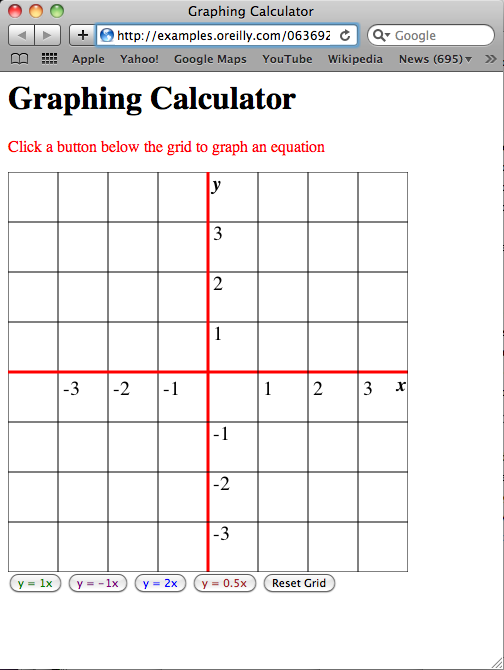
In this section, we’ll use HTML5 Canvas to implement a very basic graphing calculator for simple linear equations that can be embedded in algebra ebooks. Figure 1-2 displays the graphing calculator interface we’ll create: a two-dimensional coordinate plane with x- and y-axes marked in red, and a set of buttons below for graphing linear equations on the grid.
Here’s the HTML we’ll use to construct the graphing calculator page.
Our coordinate plane will be constructed in the
<canvas> element:
<htmllang="en"><head><title>Graphing Calculator</title><scriptsrc="modernizr-1.6.min.js"type="text/javascript"></script><scriptsrc="graph_calc.js"type="text/javascript"/></script></head><body><div><h1>Graphing Calculator</h1><pstyle="color: red;"><spanid="status_message">Click a button below the grid to graph an equation</span></p><canvasid="canvas"width="400"height="400">Your browser does not support the HTML 5 Canvas.</canvas><form><inputtype="button"id="y_equals_x"value="y = 1x"style="color: green;"/><inputtype="button"id="y_equals_negative_x"value="y = -1x"style="color: purple;"/><inputtype="button"id="y_equals_two_x"value="y = 2x"style="color: blue;"/><inputtype="button"id="y_equals_one_half_x"value="y = 0.5x"style="color: brown"/><inputtype="button"id="reset_grid"value="Reset Grid"/></form></div></body></html>
To construct the grid on the <canvas> and
graph lines, we’ll make use of a few new Canvas API functions:
moveTo(x,y)Move the Canvas “cursor” to the (x, y) location specified. Subsequent drawing operations you perform will use this location as the starting point.
lineTo(x,y)Draw a line from the current Canvas “cursor” location to the (x, y) location specified.
translate(x,y)Set a new “origin” for the Canvas, from which x- and y-coordinates are measured. By default, the Canvas origin is its top-left corner, but to simplify the graphing calculator code, it will be helpful to relocate the Canvas origin to coincide with the coordinate-plane origin at the center of the grid.
Here’s the drawGrid() function for creating the
coordinate grid on the Canvas:
functiondrawGrid(){vari=0;axis_pos=1;can_width=theCanvas.width;// Get the width of the canvas// Loop through and draw horizontal/vertical lines at each eighth of the grid// All logic below presumes canvas has square dimensionsfor(i=0;i<=can_width;i+=(can_width)/8){if(i==(can_width)/2)// Special handling for horiz/vert axes{context.lineWidth=3;// Axes are thicker...context.strokeStyle='red';//... and in red}else{context.lineWidth=1;context.strokeStyle='black';}// First draw vertical linecontext.beginPath();context.moveTo(i,0);context.lineTo(i,can_width);context.stroke();context.closePath();// Then draw horizontal linecontext.beginPath();context.moveTo(0,i);context.lineTo(can_width,i);context.stroke();context.closePath();}// Then add axis number labelscontext.font='20px _sans';context.textBaseline='top';// Move canvas origin to center of gridcontext.translate(can_width/2,can_width/2);for(i=-3;i<=3;i++){if(i!=0){// Skip labeling origin// horizontal labelcontext.fillText(i,i*(can_width/8)+5,5);// vertical labelcontext.fillText(i,5,-i*(can_width/8));}}// Add bold-italic x- and y-labels on the axes, toocontext.font='italic bold 20px _sans';context.fillText("x",(can_width/2)-12,1);context.fillText("y",4,-(can_width/2));}
First, we grab the width of the <canvas>
element (theCanvas.width), and then we run a
for loop to draw eight evenly spaced vertical and
horizontal lines across the grid; the x- and
y-axes are handled specially, bolded and colored red.
Then we run one more for loop to add number labels
(from −3 to 3) on both axes. Finally, we add x- and
y- labels to clearly identify the two axes.
Now that the grid is in place, we also need a function that will
graph a specified linear equation on the plane. We’ll create a function
called draw_grid_line() that is capable of plotting any
linear equation that can be expressed in the format y
= mx, where
m is the slope of the equation.
This function will take two parameters: slope
and color, which accepts a valid CSS color
value. Here’s the code:
functiondraw_grid_line(slope,color){if(graph_in_progress=="yes"){// Only draw one line at a timealert("Another line is being drawn. Please wait until it's complete");}else{init_x=-(theCanvas.width)/2;// start with x = left edge of grid// Note: Must reverse sign y-coordinate,// as negative y-coordinates are top half of grid by default, not bottominit_y=-(init_x)*slope// y = mxnew_x=init_x;new_y=init_y;vardrawLineIntervalId=0;status_message.innerHTML="Drawing equation y = "+slope+"x";graph_in_progress="yes"// line now being drawndrawLineIntervalId=setInterval(do_animation,33);}functiondo_animation(){context.lineWidth=6;context.strokeStyle=color;context.beginPath();context.moveTo(init_x,init_y);context.lineTo(new_x,new_y);context.stroke();context.closePath();new_x=new_x+5new_y=-(new_x)*slopecontext.lineTo(new_x,new_y)if(new_x==theCanvas.width+5){clearInterval(drawLineIntervalId);// end animation when line completegraph_in_progress="no"// line is now donestatus_message.innerHTML="Clickabuttonbelowthegridtographanequation"}}}
First, we check to see if another line is currently being drawn, and
only proceed if this is not the case; this ensures that the function is
not called twice simultaneously, since it is designed to track the
coordinates of one line at a time. Then we calculate the initial
x- and y-coordinates for the
line (init_x and init_y). For
init_x, we start at the left edge of the grid; since we
reset the origin of the Canvas to the center of the grid in the
drawGrid() function, the leftmost
x-coordinate is now equal to the negative of one-half
of the canvas width (-(theCanvas.width)/2). Then, we
calculate the corresponding init_y by taking the
negative of init_x and multiplying by the slope.
Note
It’s necessary to reverse the sign when calculating the y-coordinate, because even though we reset the origin of the Canvas to the center of the grid, y-coordinates are still measured differently on the Canvas than on the traditional Cartesian coordinate plane. On the Cartesian coordinate plane, y-values go from negative to positive as you travel up the y-axis from bottom to top, but on the Canvas, they go from negative to positive as you travel down the y-axis from top to bottom. Flipping the sign on the y-value resolves this discrepancy.
Once we have the starting point of the line, we can go ahead and
trigger the animation that draws the line on the grid. We update the
status message above the graphing calculator, and then set the
graph_in_progress variable to yes to
indicate that the line is now being drawn. Then we call the embedded
function do_animation() using the JavaScript setInterval()
method. setInterval allows us to repeatedly
call a function at designated intervals of time, measured in milliseconds.
Here, we call do_animation() every 33 milliseconds,
which will draw the line at a nice speed.
Each time do_animation() is called, we calculate
a new ending point for our line (new_x and
new_y) by increasing the
x-coordinate by 5 and calculating the corresponding
y-coordinate by taking the negative of
new_x and multiplying by the slope. Then we draw a line
from (init_x, init_y) to
(new_x, new_y). As
do_animation() is called in succession, each new line
drawn is a little bit longer than the last, which creates the visual
impression that one continuous line is being drawn across the grid.
When the x-coordinate in
new_x exceeds the right edge of the Canvas, we call
clearInterval() to end the animation, and then set
graph_in_progress to no and reset
the status message above the calculator, so that
draw_grid_line() is now ready to graph another linear
equation when triggered.
All that’s left to code is the initial setup upon page load, and the functionality for the graphing calculator buttons. Here’s the code that initializes the graphing calculator:
window.addEventListener('load',eventWindowLoaded,false);functioneventWindowLoaded(){canvasApp();}functioncanvasSupport(){returnModernizr.canvas;}functioncanvasApp(){if(!canvasSupport()){return;}else{vartheCanvas=document.getElementById('canvas');varcontext=theCanvas.getContext('2d');}initGraphCalculator();vargraph_in_progress="no"functioninitGraphCalculator(){drawGrid();vary_equals_x_button=document.getElementById("y_equals_x");y_equals_x_button.addEventListener('click',y_equals_xPressed,false);vary_equals_negative_x_button=document.getElementById("y_equals_negative_x");y_equals_negative_x_button.addEventListener('click',y_equals_negative_xPressed,false);vary_equals_two_x_button=document.getElementById("y_equals_two_x");y_equals_two_x_button.addEventListener('click',y_equals_two_xPressed,false);vary_equals_one_half_x_button=document.getElementById("y_equals_one_half_x");y_equals_one_half_x_button.addEventListener('click',y_equals_one_half_xPressed,false);varreset_grid_button=document.getElementById("reset_grid");reset_grid_button.addEventListener('click',reset_grid_buttonPressed,false);status_message=document.getElementById("status_message");}
First, when the window finishes loading, we check and see if the
user’s environment supports the <canvas> tag (if
not, the code stops executing). Then, drawGrid() is
triggered, and event
listeners are added to the buttons below the graphing calculator,
so that when the user clicks them, the corresponding functions will be
executed:
functiony_equals_xPressed(e){draw_grid_line(1,"green");}functiony_equals_negative_xPressed(e){draw_grid_line(-1,"purple");}functiony_equals_two_xPressed(e){draw_grid_line(2,"blue");}functiony_equals_one_half_xPressed(e){draw_grid_line(1/2,"brown");}functionreset_grid_buttonPressed(e){theCanvas.width=theCanvas.width;// Reset griddrawGrid();}
Now, when any of the four equation buttons is clicked, the
draw_grid_line() function is called with the
appropriate slope and color values.
When the Reset Grid button is clicked, the width
attribute is reset to its current value, which results in all contents of
the <canvas> elements being deleted. Then, the
drawGrid() function is called again to redraw the
coordinate plane on the Canvas.
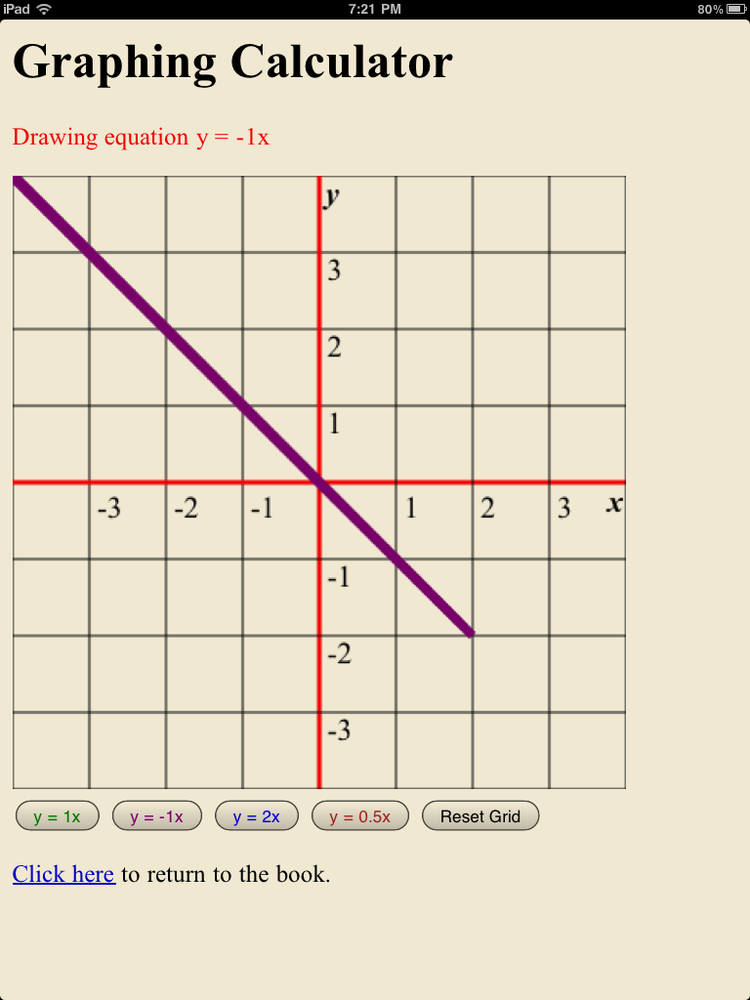
With our code complete, we’re now ready to test out the graphing calculator. Click here to try it out in your ereader. Figure 1-3 shows the graphing calculator in action in the iBooks reader for iPad.
You can also download the full graphing calculator code from GitHub.
Canvas Finger Painting
Doing animations on the HTML5 Canvas is cool, but what’s even cooler is letting the user draw on the Canvas herself. With the advent of touchscreen phones, tablets, and ereaders, this becomes even more compelling, as the user can draw directly on the screen with her finger, rather than using a mouse or trackpad. In this section, we’ll look at how to implement a simple “finger painting” app in the Canvas, which would be a nice fit for a children’s ebook—for example, a story that lets kids draw their own illustrations to accompany the text, or a preschool textbook that uses the finger painting to teach colors and shapes.
Here’s the HTML we’ll use to construct the Finger Painting page; the
<canvas> tag which will hold the drawing area is
highlighted in bold:
<!DOCTYPE html><htmllang="en"><head><title>Finger Painting</title><scriptsrc="modernizr-1.6.min.js"></script><scriptsrc="finger_painting.js"></script></head><body><div><canvas id="canvas" width="500" height="500"> Your browser does not support the HTML 5 Canvas. </canvas></div><div><h1>Finger Painting</h1><p>Click/tap a color below to select a color, and then drag/swipe on the canvas above to draw a picture.</p><p>Color selected:<spanid="color_chosen">Black</span></p><p><inputtype="button"id="Red"style="background-color: red; width: 25px;height: 25px;"/><inputtype="button"id="Orange"style="background-color: orange; width: 25px;height: 25px;"/><inputtype="button"id="Yellow"style="background-color: yellow; width: 25px;height: 25px;"/><inputtype="button"id="Green"style="background-color: green; width: 25px;height: 25px;"/><inputtype="button"id="Blue"style="background-color: blue; width: 25px;height: 25px;"/><inputtype="button"id="Purple"style="background-color: purple; width: 25px;height: 25px;"/><inputtype="button"id="Brown"style="background-color: brown; width: 25px;height: 25px;"/><inputtype="button"id="Black"style="background-color: black; width: 25px;height: 25px;"/><inputtype="button"id="White"style="background-color: white; width: 25px;height: 25px;"/></p><p><inputtype="button"id="reset_image"value="Reset Drawing"/></p></div></body></html>
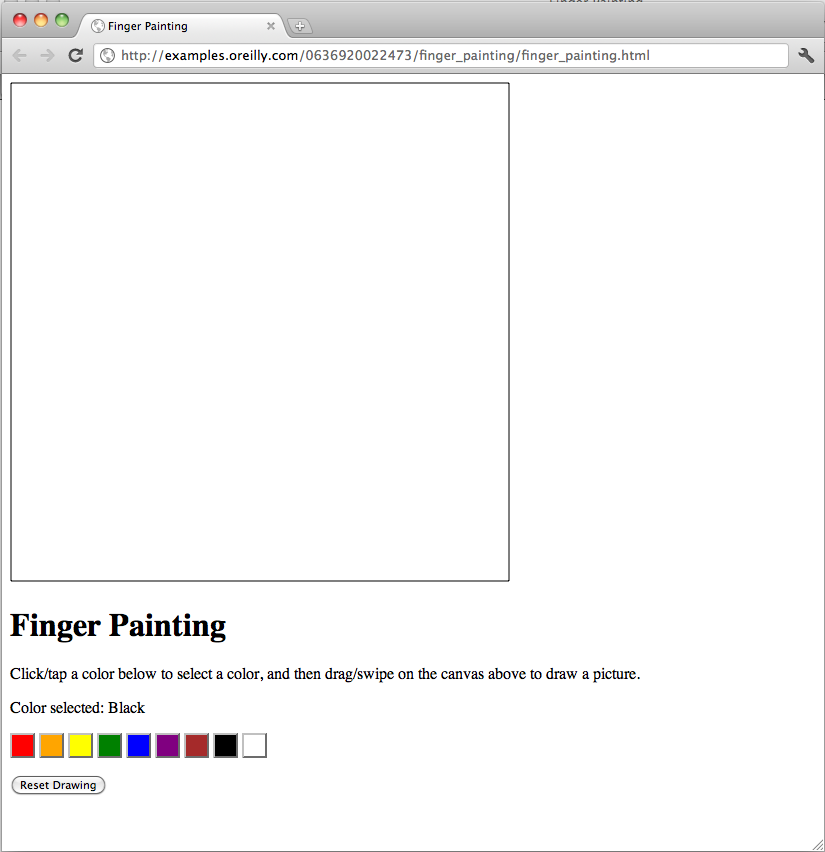
Note that the color palette below the Canvas has been implemented
using <input> buttons, which are styled with CSS
to be the appropriate color and size. Figure 1-4 displays the page in Chrome for
Mac.
In order for the user to be able to draw on the screen, we’ll need
to be able to track his cursor motions and clicks within the Canvas. We
can do so by adding event listeners to the
<canvas> element as follows:
theCanvas.addEventListener('mousedown',mouse_pressed_down,false);theCanvas.addEventListener('mousemove',mouse_moved,false);theCanvas.addEventListener('mouseup',mouse_released,false);
Now when a user presses down on the mouse within the
<canvas>, a mousemove event is
triggered in the browser, and our event listener calls the
mouse_pressed_down function. Similarly, when the mouse
is moved within the dimensions of the Canvas, the
mouse_moved function is called, and when the mouse
button is released, the mouse_released function is
called. Let’s take a look at these three functions:
functionmouse_pressed_down(ev){begin_drawing=true;context.fillStyle=colorChosen.innerHTML;}functionmouse_moved(ev){varx,y;// Get the mouse position in the canvasx=ev.pageX;y=ev.pageY;if(begin_drawing){context.beginPath();context.arc(x,y,7,(Math.PI/180)*0,(Math.PI/180)*360,false);context.fill();context.closePath();}}functionmouse_released(ev){begin_drawing=false;}
The mouse_pressed_down function serves to “turn
on” a drawing event on the canvas. It sets the variable
begin_drawing to true, and then sets
the fill color to be used to the current color selected from the color
palette.
Then when the mouse_moved function is called
(which occurs any time the mouse is moved somewhere within the Canvas), we
get the cursor’s coordinates using the
pageX/pageY properties. We check if
the begin_drawing variable is set to
true, which means that the user has the mouse button
pressed down, and if so, we draw a circle of the designated color with a
radius of 7 pixels at the cursor location.
As long as the mouse button is held down while the mouse is moved
over the Canvas, the mouse_moved function will be
called every single time the cursor location changes, which means that
circles will continue to be drawn as the mouse moves, resulting in an
effect quite similar to the Paintbrush tool in many image-editing
applications.
When the mouse button is released, the
begin_drawing variable is set back to
false, which “turns off” the drawing event. This
ensures that drawing occurs only when the mouse is held down, and not when
the mouse is moved over the Canvas without the button being
pressed.
The above code works great on desktop and laptop browsers, where a
mouse is used to interface with screen elements, but what about
touchscreen devices like the iPad? In general, touchscreen browsers do not
support
mousedown/mousemove/mouseup
events, as there is no mouse button or mouse cursor that they can track;
all those features are replaced with finger taps and swipes. However,
WebKit-based browsers support a
corresponding set of events for tracking finger motions in the browser:
touchstart/touchend/touchmove.
So we can implement the same drawing functionality as above using a
touchmove event listener:
theCanvas.addEventListener('touchmove',touch_move_gesture,false);
And the following touch_move_gesture
function:
functiontouch_move_gesture(ev){// For touchscreen browsers/readers that support touchmovevarx,y;//override default UI behavior for better results on touchscreen devicesev.preventDefault();context.beginPath();context.fillStyle=colorChosen.innerHTML;if(ev.touches.length==1){vartouch=ev.touches[0];x=touch.pageX;y=touch.pageY;context.arc(x,y,7,(Math.PI/180)*0,(Math.PI/180)*360,false);context.fill();}}
Note
The touchmove handling for touchscreen devices
is actually much simpler than the mouse-based version, because we don’t
even need to track touchstart and
touchend events. When dealing with a mouse, we need
to keep track of whether the mouse button is pressed down when it’s
being moved on the canvas. In the touch version, we know that if the
touchmove event has been triggered, the user has his
finger on the screen and is intending to draw.
And that’s the meat of the finger painting code. All that’s left is the code to initialize the event listeners, track color palette selections, and implement the Reset Drawing button functionality. Example 1-1 shows the full JavaScript code for our finger painting application.
window.addEventListener('load',eventWindowLoaded,false);functioneventWindowLoaded(){canvasApp();}functioncanvasSupport(){returnModernizr.canvas;}functioncanvasApp(){if(!canvasSupport()){return;}else{vartheCanvas=document.getElementById('canvas');varcontext=theCanvas.getContext('2d');varredButton=document.getElementById("Red");varorangeButton=document.getElementById("Orange");varyellowButton=document.getElementById("Yellow");vargreenButton=document.getElementById("Green");varblueButton=document.getElementById("Blue");varpurpleButton=document.getElementById("Purple");varbrownButton=document.getElementById("Brown");varblackButton=document.getElementById("Black");varwhiteButton=document.getElementById("White");varcolorChosen=document.getElementById("color_chosen");varresetButton=document.getElementById("reset_image");redButton.addEventListener('click',colorPressed,false);orangeButton.addEventListener('click',colorPressed,false);yellowButton.addEventListener('click',colorPressed,false);greenButton.addEventListener('click',colorPressed,false);blueButton.addEventListener('click',colorPressed,false);purpleButton.addEventListener('click',colorPressed,false);brownButton.addEventListener('click',colorPressed,false);blackButton.addEventListener('click',colorPressed,false);whiteButton.addEventListener('click',colorPressed,false);resetButton.addEventListener('click',resetPressed,false);drawScreen();}functiondrawScreen(){theCanvas.addEventListener('mousedown',mouse_pressed_down,false);theCanvas.addEventListener('mousemove',mouse_moved,false);theCanvas.addEventListener('mouseup',mouse_released,false);theCanvas.addEventListener('touchmove',touch_move_gesture,false);context.fillStyle='white';context.fillRect(0,0,theCanvas.width,theCanvas.height);context.strokeStyle='#000000';context.strokeRect(1,1,theCanvas.width-2,theCanvas.height-2);}// For the mouse_moved event handler.varbegin_drawing=false;functionmouse_pressed_down(ev){begin_drawing=true;context.fillStyle=colorChosen.innerHTML;}functionmouse_moved(ev){varx,y;// Get the mouse position in the canvasx=ev.pageX;y=ev.pageY;if(begin_drawing){context.beginPath();context.arc(x,y,7,(Math.PI/180)*0,(Math.PI/180)*360,false);context.fill();context.closePath();}}functionmouse_released(ev){begin_drawing=false;}functiontouch_move_gesture(ev){// For touchscreen browsers/readers that support touchmovevarx,y;//override default UI behavior for better results on touchscreen devicesev.preventDefault();context.beginPath();context.fillStyle=colorChosen.innerHTML;if(ev.touches.length==1){vartouch=ev.touches[0];x=touch.pageX;y=touch.pageY;context.arc(x,y,7,(Math.PI/180)*0,(Math.PI/180)*360,false);context.fill();}}functioncolorPressed(e){varcolor_button_selected=e.target;varcolor_id=color_button_selected.getAttribute('id');colorChosen.innerHTML=color_id;}functionresetPressed(e){theCanvas.width=theCanvas.width;// Reset griddrawScreen();}}
Click here to try out the Finger Paiting app in your ereader. Figure 1-5 shows a completed drawing in the Finger Painting app in the iBooks reader for iPad.
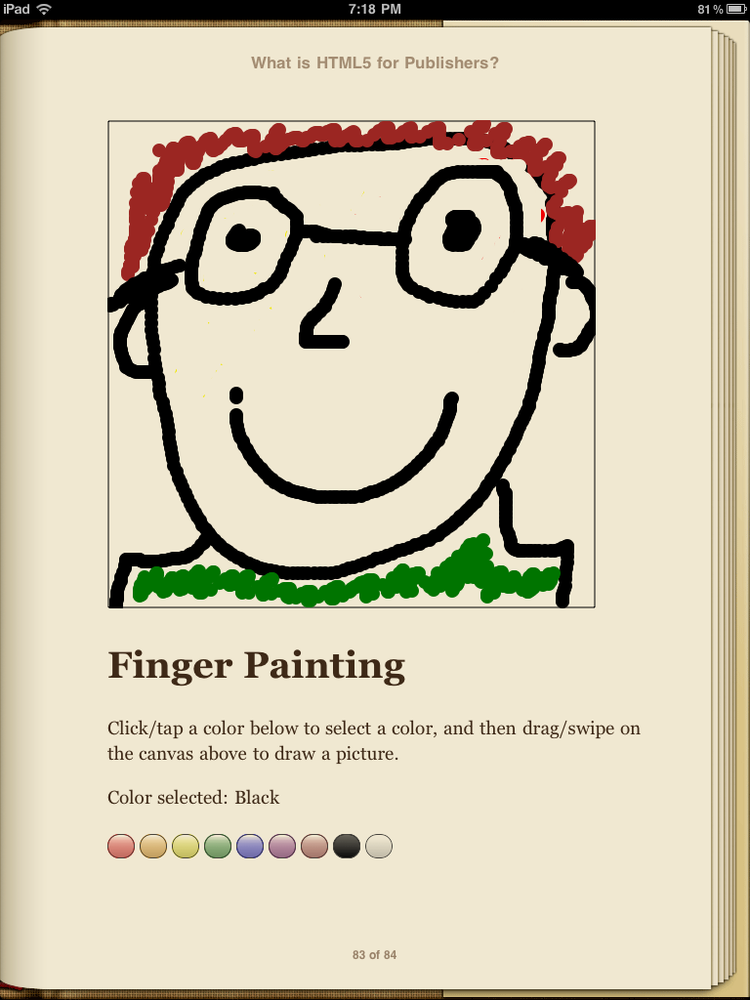
Pretty cool, right? Although maybe not as impressive as what you can do in some other touchscreen finger painting apps.
HTML5 Canvas, EPUB, and Ereader compatibility
So, as we’ve seen, HTML5 Canvas is incredibly powerful and
versatile, but the $64K question that’s probably in your head is, “Which
major ereading devices are currently compatible with
<canvas> content?” Unfortunately, the answer at
the time of publication (January 2013) is “Only one.” Currently, the
iBooks reader for iPad/iPhone/iPod touch is the only major ereader that
supports and can render <canvas> content, which
means that if you want to embed <canvas> apps
directly in your EPUBs, you’re likely limiting the audience of your ebook
quite significantly. That said, here are a couple options you may want to
consider if you’d like to include Canvas apps in your EPUB, but want to
mitigate the incompatibility with other EPUB readers (e.g., NOOK, Sony
Reader, Adobe Digital Editions):
Include fallback content within your
<canvas>elements that will be displayed if the user’s ereader doesn’t have Canvas support (see the beginning of this chapter for more details). This way, while readers won’t be able to use the app, you can display text, images, etc., that can potentially convey some of the same information that would have been displayed on the Canvas.Instead of (or in addition to) just embedding your Canvas apps directly in the EPUB, consider hosting them on the Web and linking to them from your EPUB, so that readers can access them from a traditional Desktop or mobile web browser. Many modern hardware ereaders (e.g., the NOOK Color and NOOK Tablet) have built-in web browsers, so even if the ereader software itself doesn’t support
canvas, the web browser may. Additionally, readers viewing your EPUB on a desktop/laptop machine (say, in Adobe Digital Editions) can click on your link and run the Canvas app in Firefox or Chrome. The one downside of this approach is that readers will obviously still need Internet access in order to access the app.
Longer-term, it’s likely we’ll start seeing more widespread support
of HTML5 Canvas in ereaders within the next 6–12 months. HTML5 support is
an integral part of the EPUB 3
specification approved by the IDPF (International Digital Publishing
Forum) on October 11, 2011. Under EPUB 3, content documents must
use HTML5 syntax, which means EPUB 3–compliant reading systems
must support the <canvas> tag. That said, the
spec also currently says that “EPUB
Reading System support for scripting is optional,” which means
that ereaders are not required to support the JavaScript code that drives
your Canvas applications. But in order to offer the full benefits of HTML5
and EPUB 3, I think it’s a safe bet that most touchscreen, non-eInk EPUB
ereaders will be providing full Canvas support in the near future, if for
no other reason than to stay competitive with iBooks in offering
publishers a platform for delivering rich interactive ebook
content.
Bibliography/Additional HTML5 Canvas Resources
Here are some additional resources I highly recommend for learning more about Canvas:
- HTML5 Canvas by Steve Fulton and Jeff Fulton (O’Reilly Media)
A great introduction to HTML5 Canvas for beginners, and an even better reference book for advanced JavaScript programmers. This book covers everything from simple Canvas animations to advanced physics-based movement, and shows you how to design simple drawing apps and advanced arcade games alike.
- Canvas Pocket Reference by David Flanagan (O’Reilly Media)
Excellent mini-reference guide to the complete Canvas API.
- Client-side Graphics with HTML5 Canvases: An O’Reilly Breakdown by David Griffiths (O’Reilly Media)
Video tutorial on HTML5 Canvas. Learn how to build a retro arcade game.
- Creating an HTML5 canvas painting application by Mihai Sucan
If you’re interested in building an HTML5 canvas painting application of your own, you may want to check out this cool tutorial.
- Touching and Gesturing on the iPhone by nroberts
The best tutorial I found online on touch events for WebKit browsers. If you have a mobile touchscreen browser, definitely check out this demo.
Get HTML5 for Publishers now with the O’Reilly learning platform.
O’Reilly members experience books, live events, courses curated by job role, and more from O’Reilly and nearly 200 top publishers.

