Graphing equations
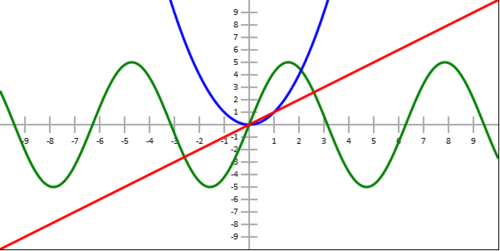
In this recipe, we'll create a configurable Graph class that draws the x and y axis with tick marks and values, and then we'll construct a method called drawEquation()
that allows us to graph f(x) functions. We'll instantiate a Graph object and then draw a sine wave, a parabolic equation, and a linear equation.
How to do it...
Follow these steps to create a Graph class that can draw an x and y axis with values, and also graph multiple f(x) equations:
- Define the constructor for the
Graphclass that draws the x and y axis:function Graph(config){ // user defined properties this.canvas = document.getElementById(config.canvasId); this.minX ...
Get HTML5 Canvas Cookbook now with the O’Reilly learning platform.
O’Reilly members experience books, live events, courses curated by job role, and more from O’Reilly and nearly 200 top publishers.

