Creating a bar chart
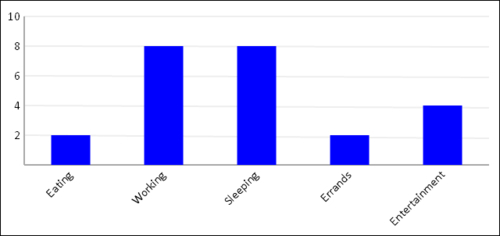
Right behind pie charts, bar charts are another popular tool for visualizing data. In this recipe, we'll create a configurable Bar Chart class that takes in an array of data elements and creates a simple bar chart. We'll reuse the data structure from the previous recipe to compare the results. Like the Pie Chart class, the bar chart drawing methods also automatically scale the chart to fill up the canvas.
How to do it...
Follow these steps to create a Bar Chart class that can automatically position and size a bar chart from an array of data:
- Define the
BarChartconstructor which draws the chart:/* * BarChart constructor */ function ...
Get HTML5 Canvas Cookbook now with the O’Reilly learning platform.
O’Reilly members experience books, live events, courses curated by job role, and more from O’Reilly and nearly 200 top publishers.

