Creating a pie chart
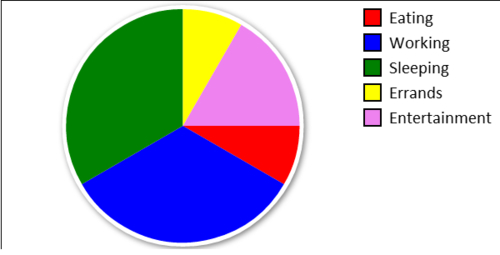
Pie charts are probably one of the most common data visualizations because they quickly give users a sense of the relative weights of data elements. In this recipe, we'll create a configurable Pie Chart class that takes in an array of data elements and produces a pie chart. Furthermore, we'll construct the Pie Chart drawing methods in such a way that the pie chart and label automatically fills up as much of the canvas as possible.
How to do it...
Follow these steps to create a Pie Chart class that can automatically position and size a pie chart and a legend from an array of data:
- Define the constructor for the
PieChartclass which ...
Get HTML5 Canvas Cookbook now with the O’Reilly learning platform.
O’Reilly members experience books, live events, courses curated by job role, and more from O’Reilly and nearly 200 top publishers.

