Appendix A Selected Distributions
Distribution Name: Triangular
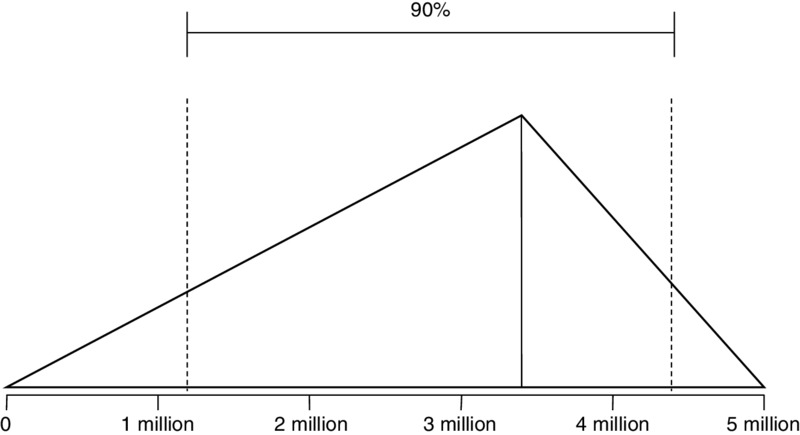
Figure A.1 Triangular Distribution
Parameters:
- UB (Upper bound)
- LB (Lower bound)
- Mode—this may be any value between UB and LB.
Note that UB and LB are absolute outer limits—a 100% CI.
For a triangular distribution, the UB and LB represent absolute limits. There is no chance that a value could be generated outside of these bounds. In addition to the UB and LB, this distribution also has a mode that can vary to any value between the UB and LB. This is sometimes useful as a substitute for a lognormal, when you want to set absolute limits on what the values can be but you want to skew the output in a way similar to a lognormal. It is useful in any situation where you know of absolute limits but the most likely value might not be in the middle, like the normal distribution.
- When to Use: When you want control over where the most likely value is compared to the range, and when the range has absolute limits.
- Examples: Number of records lost if you think the most likely number is near the top of the range and yet you have a finite number of records you know cannot be exceeded.
-
Excel Formula:
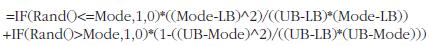
- Mean: = (LB+Mode+UB)/3
Distribution Name: Binary
Figure A.2 Binary Distribution
Parameters:
- P (Event probability)
Get How to Measure Anything in Cybersecurity Risk now with the O’Reilly learning platform.
O’Reilly members experience books, live events, courses curated by job role, and more from O’Reilly and nearly 200 top publishers.

