Response Formats
The format used to report responses to dimensions and questions depends on what the tabulator can provide and what you want. This is something you should decide in advance.
Generally, responses are reported by percentages of those responding to a question. However, they can also be reported as whole numbers. Typically, they are reported in tables or as bar graphs.
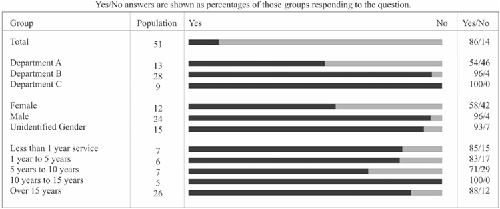
Figure 11-1 shows a bar graph reporting responses to an objective (yes/no) question. Reporting is by total employees, department, gender, and length of service.
Figure 11-1. Are you notified of job openings in other departments?

Figure 11-2 displays bar graphs for responses ...
Get How to Design, Implement, and Interpret an Employee Survey now with the O’Reilly learning platform.
O’Reilly members experience books, live events, courses curated by job role, and more from O’Reilly and nearly 200 top publishers.

