Chapter 20
Rounded Tops
The chart formation called the rounded top is precisely what it sounds like—a topping pattern, implying a significant move lower, that is made up of a series of higher highs and then higher lows, which taken altogether create a rounded effect.
DEFINITION OF THE PATTERN
The first prerequisite for the pattern is that it has to be preceded by a sharp rise in price. The point of finding the pattern in the first place is to sell the stock short, close a long position, or buy put options on it—whatever your trading objective might be—in anticipation of a drop in price. Unless the stock has already risen substantially, there will be too much support beneath the price level to create the opportunity for a substantial drop.
Capital One Financial, shown in Figure 20.1, had risen significantly when it started forming its rounded top in early 2003. In 2004, 2005, and the first half of 2006, it made a series of higher highs, but the rate of ascent of those highs diminished each time, forming the beginning of the rounded top you can see drawn here after the fact.
FIGURE 20.1 Capital One lost 88 percent of its value after this formation.
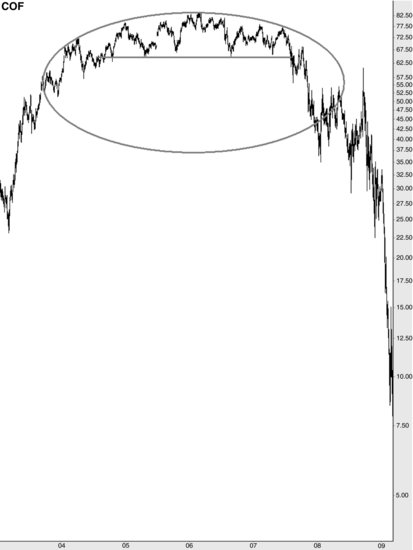
Starting in mid-2006, the stock subtly changed direction and began making a series of lower highs at increasingly sharp angles. This gentle progression of higher highs and then lower highs is the next requirement, because that is the ...

