We mentioned in Chapter 1 that performance improvements are not a one-time task, but are something that should be revisited in iterations throughout the lifetime of a website. Load testing is an important aspect of any project: it provides insight into how your site and infrastructure will react under load. While critical to the launch process of any project, load testing is also useful to integrate into your standard testing procedure. It can help you locate bottlenecks and generic performance regressions introduced in the evolution of a site after launch (due to code and infrastructure changes).
There are many different methodologies and applications for performing load tests, but generally this testing involves accessing various pages on the site with enough traffic to start causing degradation. From there, work can be done to isolate bottlenecks in order to improve performance. If you perform periodic load tests, you are much more likely to catch something while it’s still a minor performance issue, not after it becomes a major problem.
There are a number of different load testing configurations (sometimes referred to as test plans) that can be used individually or in conjunction to provide insight into site performance. Generally, we end up running three different types of tests:
- Baseline tests
- These tests are run with a relatively low amount of traffic in order to obtain some baseline information about site performance. These are useful for tracking general user-facing performance (time to first byte, time for a full page load) and for comparing against a higher-traffic load test result, as well as for tracking regressions in the standard case.
- High traffic tests
- Tests with relatively higher traffic are run in order to see when site performance begins to degrade as traffic increases. These tests can give you an idea of how many requests a site can handle before performance deteriorates to an unacceptable degree. At the same time, these types of tests are very good for uncovering bottlenecks in a site; many times issues with underlying services or service integration require a higher load in order to trigger. Generally speaking, this type of load test is the one that is run most frequently.
- Targeted tests
- Most tests are designed to cover all different request types and page types for a site. Targeted tests take a different approach; they are designed to test one or several specific features or user paths. For example, if you are working to improve the performance of a certain page type on your site, you could run a load test that only focuses on that particular area.
Depending on the load testing tool in use, these tests could all be based on the same test plan by tweaking the amount of traffic generated and/or by enabling or disabling certain parts of the test plan in order to focus testing on only a subset of the site.
One of the most difficult aspects of load testing is creating a test that represents real site traffic. If the test diverges greatly from real traffic patterns, the performance results and bottlenecks found during the test may not help you improve real-world performance in a meaningful way. By starting with a test that as closely as possible matches real-world traffic (or expected traffic, if you are looking at a new/growing site), you’ll more reliably uncover performance issues on your site. Fine-tuning a load test can happen over time in order to keep it in line with shifting traffic patterns and new features added to a site. Things to take into consideration when creating and reviewing a load test plan include:
- User browsing patterns
- What pages are visited most often? How long do users spend on different page types? What are the most common entry points into the site?
- Logged-in traffic
- What percentage of traffic is logged in versus anonymous users? Do logged-in users visit different pages than anonymous users?
- Amount of content
- When creating a new site, do you have enough content on the site to perform a valid test? If not, then consider creating content programmatically before running a test. The Devel module is great for this purpose (among other things).
There are many ways to approach load testing for a given website and infrastructure. How frequently tests are run is entirely up to you. Some sites may run a load test manually once per month, while others may run tests multiple times per day. Whatever you decide, it’s important to run a baseline test occasionally to understand what “normal” performance looks like. Only once you have baseline numbers for user-facing and server-side performance during a load test can you define what is “good” or “bad” in a particular test result.
Testing can be tied into your development process using a tool such as Jenkins (described in more depth in Chapter 9). Tests could be set up to run each time a new release is pushed to the staging environment, or if you have sufficient resources, tests could even be run each time new code is pushed to the site’s code repository.
For those who don’t want to deal with the overhead of testing for each new code push, an alternative approach is to test on some predetermined schedule. This could be daily, weekly, or even monthly. The more frequently tests are run, the easier it will be to directly link a change in performance to a specific change on the site. If you go too long between tests, it can become much harder to pinpoint the cause of a performance problem.
In addition to the previously described approaches, it can be useful to run manual tests occasionally, especially if you are trying to test a specific aspect of the site with a targeted test plan. For example, if you are planning a media event that will drive a lot of new users to your site, it might be beneficial to run targeted tests against the main site entry points and features that may receive higher than normal traffic, such as user registration.
One problem that many people encounter with load testing is that they are bombarded with too much data in the results, and it’s not always clear what information is important. In most situations, you will at least want to examine:
- Time to first byte
- Also referred to as latency in some load testing applications. This is quite important as it usually represents the actual Drupal execution time (or caching time), whereas other data points are less focused.
- Full page load time
- Also referred to as response time in some applications. The difference between time to first byte and this is mainly due to the size of the page, the network path, and other issues.
- Requests per second
- The number of page requests per second is an important statistic to look at when planning for traffic loads and infrastructure scaling.
- Error responses
- These are another very important data point, and also the most likely to be ignored. A failing site will often load test very well; however, those results are obviously not providing very useful information and misrepresent the actual site performance. Paying attention to the error responses can give you an idea of where problems may be occurring. For example, Apache may have timeouts waiting on backend requests such as connecting to MySQL when the DB server is overloaded, and in those cases may return a 503 error.
Depending on what the goals are for your load test, you may also be looking at additional information such as bytes transferred or throughput for a particular page.
No matter what data you choose to track, it becomes even more valuable if you are able to track it over time. By comparing multiple test results, you’ll get a much better idea of your site’s performance as well as gaining the ability to see trends in the performance data. It can be very useful to observe things like page load time to see how it varies over time, or how it might increase or decrease in response to a specific code or infrastructure change.
Another important consideration is to understand how requests from load testing software differ from requests made by a user using a standard web browser. For example, JMeter, which we cover later in this chapter, does not execute JavaScript, and by default it will not download linked assets on a page (more on this in Example Load Test Using JMeter). In general, those differences are acceptable as long as they are understood. However, it can be worthwhile to perform some sort of additional testing with a tool that more accurately represents a browser. These tools are not always capable of high-traffic load tests, but they can at least be used to establish a baseline.
When you run a load test, you’ll be presented with a list of results that focus entirely on client-side performance, since that is all that the load testing application can see. It’s important to monitor servers and services during load test runs in order to get the most from your tests and to be able to track down infrastructure bottlenecks. Of course, this sort of monitoring could be left to the automated systems you set up while reading Chapter 8, but it can also be useful to manually watch the servers during test runs to see how things are affected and adjust what you are monitoring. Different sites will suffer from completely different infrastructure bottlenecks, so it’s best to keep an eye on as much data as possible, but for starters we recommend:
- Web servers
-
Watch overall system load, memory usage, swap usage, network traffic, and disk I/O. Also keep track of things like the Apache process count to see if you are approaching (or hitting!) the
MaxClientssetting. As always, don’t forget to watch logs for Apache to see if any errors are being reported. - Reverse proxies and other caches, such as memcached
- Watch load, network traffic, and caching statistics. Is your cache hit rate higher or lower than normal? Try to understand why that might be (e.g., a test plan that only hits a very small subset of the site’s pages would likely cause higher cache hit rates). Watch memory usage and evictions to be sure that the cache isn’t becoming overly full and forced to delete items before they’ve expired.
- Database servers
- Watch the server load and connection count, and watch the MySQL error log for any unusual errors. Ensure that the MySQL slow query log is enabled, and watch it for potential query improvements that can be made (see e.g. pt-query-digest in the Percona Toolkit). You can also watch MySQL statistics directly or with tools such as mysqlreport to monitor things like InnoDB buffer usage, lock wait times, and query cache usage. Watch the MySQL process list to see if there are certain queries running frequently or causing waits for other queries.
There are a number of options to determine which environment to run load tests against: development, staging, production, or potentially some environment dedicated to load testing. In an ideal world, tests should always be run against the production environment to obtain the most valid data possible. However, site users (not to mention investors) tend to dislike the website becoming unusably slow due to a load test. While some people may be able to run tests against production, even if it means scheduling the test for 3 a.m. or some other low-traffic time, others won’t have that option. Our advice is to take into account what the goals and requirements are for your load testing and, based on that, run the tests against an appropriate environment.
Note
One other consideration when planning which environment to run a load test against is whether or not the test will be creating and/or deleting data on the site. In general, testing things like user comments against a production site can be very difficult to do in a way that doesn’t interfere with your users.
As we mentioned in Chapter 7, the more closely your staging environment mimics production, the more useful it will be. In the case of load testing, staging can be a very fitting place to run load tests. While your staging servers may not be as numerous and high-powered as those in the production environment, you can still easily track down many performance issues and infrastructure bottlenecks by running tests against the staging environment if it is similar to your production environment.
Another option is to run tests against a development environment. This is especially valid for tests integrated with CI. While the performance numbers here will, expectedly, differ from in production, it’s still a great way to test for performance changes when code changes occur.
Note
When running tests against an environment that is not your production environment, be aware that any user-facing performance numbers should be taken with a grain of salt. That is, performance will likely be slower than in your production environment, but the numbers can still be useful when comparing test results over time.
In cases where test or staging environments are under heavy use, it may not be possible to run load tests against those environments. For those situations, usually the only alternative is to have a dedicated “load testing” environment used specifically for load tests—or potentially also for other automated tests, such as acceptance testing). As always, the more closely this environment can mimic production, the more valid your test results will be. For those infrastructures that run mostly in the cloud, this environment might be spun up on demand when tests need to be run, but otherwise left offline.
Some sites might insist on running load tests against production in order to have “real” numbers. While this can make sense in certain situations, it’s rare that a dedicated staging environment won’t be sufficient to get the data required. Generally, our recommendation would be to only run low-traffic tests against production in order to obtain user-facing performance information. If you are trying to put the site under a heavy load in order to catch performance bottlenecks, then doing so in a staging environment should yield useful results.
While there are many load testing applications and services available, JMeter is one open source option that we have used extensively. JMeter tests are fairly flexible, and the ability to run tests either from a GUI or directly from command line makes it convenient for running tests remotely. As an example, we’ll configure a simple load test plan with JMeter that logs into a Drupal site, visits a few pages, and then logs out. Once this is complete, you can configure how many concurrent threads you would like to run and for what duration, and you should have a good understanding of how it might be adapted to run against your own site.
Note
JMeter has some downsides: it doesn’t execute JavaScript, nor does it render the HTML for pages it retrieves. You can still get useful performance information from JMeter tests, but be aware of those limitations and plan for another way to test JavaScript and rendering times if needed. There are multiple options for this type of testing, including Selenium and PhantomJS.
First, we need to understand the structure of the site we’ll be testing. Our example is a standard Drupal 7 site with some “static” node pages, a forum section, and a front page that dynamically displays custom content to logged-in users, or a list of featured articles for anonymous users. For our load test, we’ll want to test each of these different page types—plus, it’s always important to focus attention on the front page, both for anonymous and logged-in users. You don’t want people leaving your site because the front page took too long to load!
When you first launch JMeter, you will be presented with an empty test plan. We’ll start by naming the test plan something original, like Drupal, by editing the Name field. Next, we’ll start adding some global settings that we’ll refer to in other parts of our test. Settings are stored in objects that JMeter refers to as Config Elements, and in this case, we’re going to add one of the type User Defined Variables. To add this to the test, right-click on the test plan icon in the left toolbar and select Add→Config Element→User Defined Variables. The new element should appear as a child under the test plan.
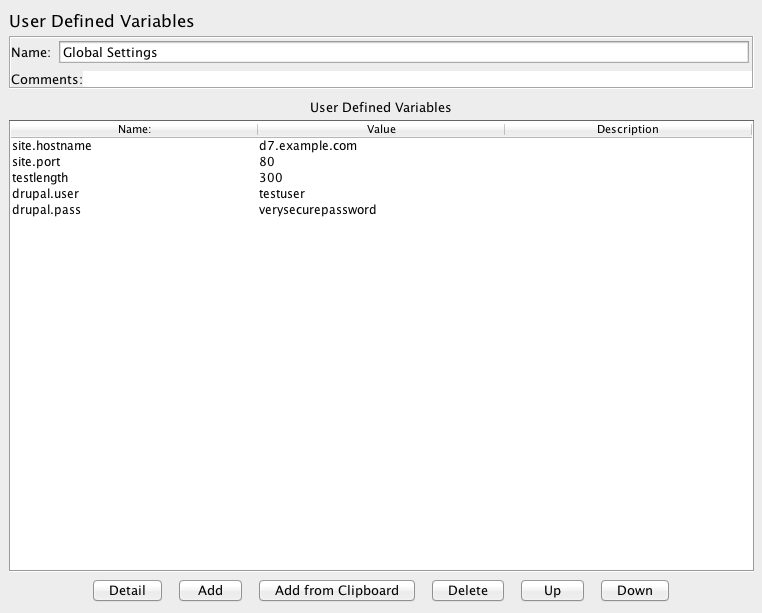
Select the new object, and change the name to something useful like Global Settings. Next, we’re going to add the variables listed in Table 20-1.
Table 20-1. JMeter global settings
| Name | Value |
|---|---|
|
|
|
|
|
|
|
|
|
|
Of course, you’ll want to set the hostname to your site’s real hostname, and set the user account and password to some existing (nonadmin) account. We will use that account for the test threads to log into the site. The testlength variable will be used to control how long the test runs (in seconds). Once complete, the settings should look something like Figure 20-1.
Note
We are using only a single account in this test in order to keep the example as simple as possible. You should consider using many (dozens, or hundreds, depending on your site’s user base) user accounts to more accurately reflect real-world traffic.
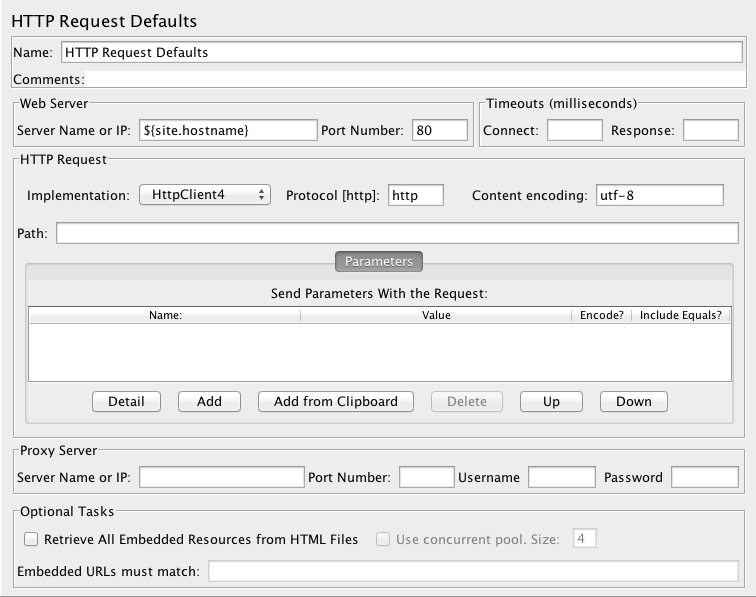
Next, we’ll create an HTTP Request Defaults Config Element in order to store default values for all of the HTTP requests we’ll make later in the test. This saves us having to enter things like the server hostname in every single request, since if it’s not specified, it will fall back to these default values. Right-click on the test plan and go to Add→Config Element→HTTP Request Defaults. In the HTTP Request Defaults configuration, set Server Name or IP to our global variable, ${site.hostname}, set Port Number to the variable ${site.port}, and then set Implementation to HttpClient4, Protocol to http, and Content encoding to utf-8. Once complete, your settings should look like those in Figure 20-2.
Note
As mentioned previously, JMeter will not download linked assets by default. This includes CSS, images, applets, and iframes. This differs greatly from what happens when an actual user accesses your site, since the user’s browser will download all of those assets. The setting for controlling this behavior in JMeter is Retrieve All Embedded Resources from HTML Files, located in the Optional Tasks section of HTTP Request Defaults or any individual HTTP Request. Many sites leave this setting disabled since most slowdowns and infrastructure bottlenecks are caused by serving the page itself, not the linked assets. This is especially true when you have incorporated a reverse proxy or a CDN to cache static assets. That said, if you choose to leave this option disabled for standard test runs, we advise running periodic tests with it enabled to ensure that asset delivery is happening as fast as expected.
JMeter has the concept of thread groups, which is a way to group together a set of threads that will perform certain requests (anything defined as a child of the thread group) against the site. This can be useful for splitting up the test into different sections—e.g., tests for things like authenticated users versus anonymous users. Because thread groups each have configurable settings for timing and number of threads, it’s also possible to use them to put different traffic loads on different parts of the site. In our case, we’re going to define a single thread group for authenticated traffic, though it will also include an anonymous visit to the site’s front page. For a more complete test plan, it would be useful to also add at least one more thread group to handle anonymous traffic, but we leave that as an exercise for the reader.
Note
JMeter threads are not the same as real users on your site. While a single thread may seem like it closely represents a user, remember that JMeter is not rendering pages or reading content once it’s displayed—it’s just loading pages as fast as possible and then going on to load the next page in the test plan. This can give you an idea of how many requests per second your site can handle, but it does not directly translate into the number of users your site can handle.
To add a thread group, right-click on the test plan icon in the lefthand toolbar and go to Add→Threads (Users)→Thread Group. The new thread group should appear below your global settings in the left toolbar, as shown in Figure 20-3. Name it Authenticated Users so that you know what type of testing it will be handling. Now we’ll want to configure the number of threads—let’s go with 10 for now, as that’s a relatively small amount of traffic but should still give us a good baseline on performance. The Ramp-Up Period is how long JMeter takes to create all of the threads. Let’s set that to 20 seconds, meaning JMeter will create a new thread every two seconds until it hits the 10 total threads we’ve configured.
There are a couple of options for how to control the test duration. First, you could set a loop count on the thread group. This controls how many times each thread loops over the test plan within the thread group. In our case, we’ll set this to ‘Forever', and instead we’ll set a limit on the time duration of the test. To do this, click the ‘Forever’ checkbox next to ‘Loop Count', and then click the ‘Scheduler’ checkbox to enable the scheduler. It will fill in ‘Start Time’ and ‘End Time’ with the current date and time; that can be ignored. In the ‘Duration’ setting, add the value ${testlength} which will use the testlength variable that we defined in our global settings. Once complete, the test plan order and thread group settings should look like Figure 20-3.
![JMeter thread group[]](/api/v2/epubs/9781449358013/files/httpatomoreillycomsourceoreillyimages1821095.png)
This thread group is intended to simulate authenticated traffic, which means that we’ll need to handle the session cookies used by Drupal. In JMeter, this can easily be accomplished by using an HTTP Cookie Manager. This is a configuration element similar to the User Defined Variables element we are using to store global variables. In this case, however, we’ll keep the HTTP Cookie Manager as a child of the Authenticated Users Thread Group instead of using it globally, since it is private to this thread group.
In order to add an HTTP Cookie Manager, right-click on the thread group and go to Add→Config Element→HTTP Cookie Manager. It should show up indented to represent that it is a child of the Thread Group element—if it doesn’t show up in the correct location, you can drag and drop it within the left toolbar to add it as a child of the thread group.
Configuration of the HTTP Cookie Manager is very simple. The only setting that we need to change from the defaults is to select Clear cookies each iteration. That will remove any cookies from a thread after it’s gone through one loop of the thread group tests, meaning that each thread starts fresh (similar to a new user) each time it loops through the thread group.
Although it’s not too complicated, performing the Drupal login is probably the most difficult part of this particular load test plan. The login itself is quite simple: we just need to POST the username and password to the /user/login form page. What makes this more difficult is that the form also contains a hidden form_build_id input containing a random hash, which we’ll need to POST with the form in order for Drupal to accept the submission. To accomplish this, we’ll need to first load the form (located at /user), and then use a Regular Expression Extractor to pull the form_build_id string out of the page source. This same technique will work for any Drupal form. Do you feel like a spammer yet?
Let’s start by adding a Simple Controller under the thread group. We’ll use this to group together all of the login logic to keep it self-contained. It doesn’t matter to JMeter if we do this or not, but it makes the test plan more readable, and it also makes it easy to duplicate the form handling logic should we ever need it elsewhere on the site. Right-click on the thread group and go to Add→Logic Controller→Simple Controller; it should appear underneath the HTTP Cookie Manager, also as a child of the thread group. The Simple Controller has no options aside from its name; we’ll name this one Login.
Now we can add the request elements needed in order to fetch and submit the login form. The process consists of requesting the /user page, pulling out the form_build_id string from the response data, and then submitting the form with a POST request to /user/login. We’ll start by creating an HTTP Request element to request the /user page. Right-click on the new Login controller we just created and go to Add→Sampler→HTTP Request. Change the name to User Form. Since we have a global HTTP Request Defaults object set up, there’s no need to fill in most of the request fields. The only thing we need to set is the Path, which needs to be set to /user.
In order to get the form_build_id, we’ll need to create a Regular Expression Extractor as a child of the User Form request. Right-click on the User Form request and go to Add→Post Processors→Regular Expression Extractor. It should show up as a child of the User Form request, but drag it there if not. Name the extractor Drupal form build id. We’ll keep the defaults for the other settings, and then we just need to create a regular expression to extract the form_build_id string. The string appears in the page source like this:
<input type="hidden" name="form_build_id"
   value="form-P6bhzmdBofDC_AZ-yjHn6ZB-R35b5ljF1hmTEwXbDF0" />
Everything after form- in the value string is a random hash specific to that particular form, but we’ll want to grab the whole string including the “form-” at the beginning. To do this, we can use the following regular expression:
name="form_build_id" value="(.*?)"
For the Reference Name, enter form_build_id—this is the variable name we’ll be able to use later to refer to this value. Next, for Regular Expression, enter the regular expression just shown. For Template, enter $1$—this tells JMeter to assign whatever is in the first reference (in between the parentheses in the regular expression) to the variable we’re creating. Finally, for Match Number, enter 1—this tells JMeter to apply this regular expression to the first match it comes across. Note that if you have multiple forms showing up on the login form (such as a search box in the header), you may need to adjust this.
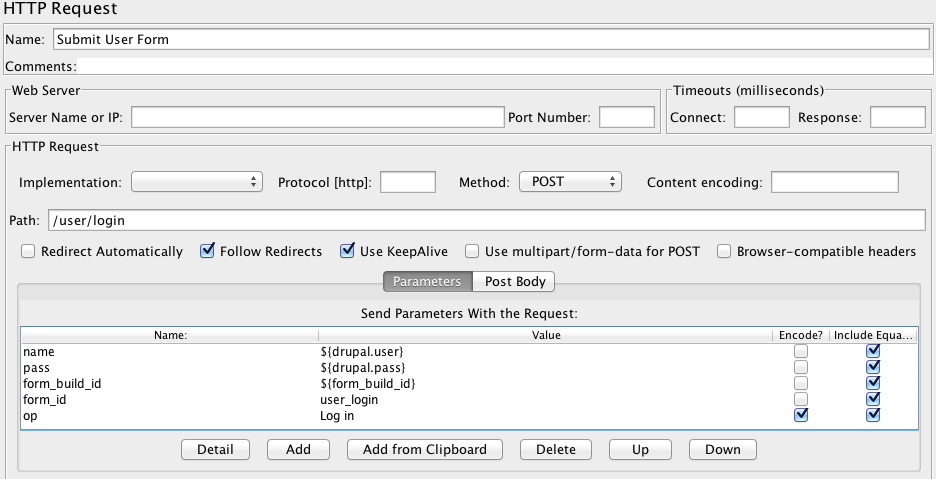
Now we’ll create a second request for submitting the form. Right-click on the Login Controller and go to Add→Sampler→HTTP Request. If needed, drag it so that it appears underneath the User Form request, but still as a child to the Login Controller. Name this request Submit User Form, change the Method setting to POST since we’re submitting a form, and then set the Path to /user/login. Next, we’ll need to add a list of parameters to send with the request. These can be added by clicking the Add button below the parameters list. Add the parameters shown in Table 20-2.
Table 20-2. User login parameters
| Name | Value | Encode | Include Equals |
|---|---|---|---|
name | ${drupal.user} | No | Yes |
pass | ${drupal.pass} | No | Yes |
form_build_id | ${form_build_id} | No | Yes |
form_id | user_login | No | Yes |
op | Log in | Yes | Yes |
For name and pass, we are referring to the variables we set in the global settings earlier. form_build_id uses the results from our regular expression extractor to submit the appropriate form_build_id. form_id is another hidden field that we need to submit, and op is the name of the submit button for the form. The top portion of the Submit User Form request should look like Figure 20-4—nothing needs to be changed below the parameters list.
Now that we have the ability to log into the site, we’ll create a list of a few pages that we want to test. Start by creating another Simple Controller as a child of the Authenticated Users thread group, and name it Browse—this will be used as a container for our authenticated user page browsing requests. Be sure that this controller is below the Login Controller, but as a direct child of Authenticated Users, not as a child of the Login Controller. Next, we’ll create individual HTTP Request elements for each page that we want to test.
Note
Another approach to this is to create a CSV file listing URLs to visit. This can be easier to maintain for a large number of paths. We won’t describe this approach in detail, but it can be done by using a CSV Data Set Config element to read the CSV file into a list of variables.
For each page we’re going to test, we’ll create an HTTP Sampler by right-clicking on the Browse controller and going to Add→Sampler→HTTP Request. Since we’re using the HTTP request defaults, the only settings that need to be changed for each request are the name and path. In the case of our example site, we’ll want to test the front page, the forum index, a forum post, and a couple of article pages. We’ll do this by adding request elements for the name/path combinations listed in Table 20-3.
Table 20-3. Page requests
| Name | Path |
|---|---|
Front Page | / |
Article 1 | /somearticle |
Article 2 | /anotherarticle |
Forum Index | /forum-index |
Forum Post 1 | /forum/post-1 |
These are actual paths on our test site, but you’ll obviously want to adjust these to fit your site, being sure to cover all the various page types you have in place.
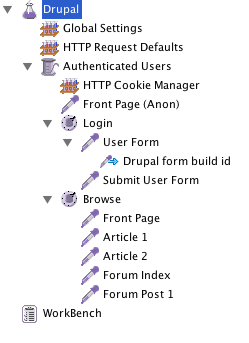
We’re now testing a full set of pages as an authenticated user. However, it would also be useful to test at least the front page as a nonauthenticated (anonymous) user, since many people will visit the front page directly before logging in. To simulate this, create a duplicate of the Front Page request element, rename it Front Page (Anon), and drag it just above the Login Controller. This way, each thread will request the front page before logging in and proceeding to visit the other pages. Once we’ve done this, our test plan looks like Figure 20-5.
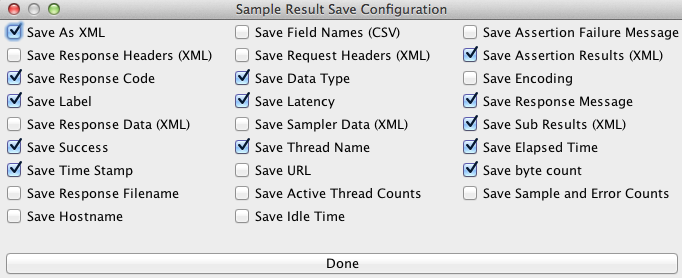
Now that our test plan is complete with a set of page requests, the only piece missing is to save the request results. This is done by creating a Simple Data Writer element within the test plan. The data writer could be created at the global level in order to save all requests from a test, or it could be placed within a thread group in order to save results only from that set of requests. This is useful if you have multiple thread groups (e.g., Authenticated Users and Anonymous Users) and want to write out to different data files for each of them. You can have data writers at as many levels of the test as you like. In our case, we’ll add one global data writer to catch all requests. To do this, right-click on the test plan and go to Add→Listener→Simple Data Writer. Name it Full Test Output, and enter a filename for it to save to, such as /path/to/jmeter-test/full-output.jtl.
Data writers have many options regarding which data to save in the file. Note that if you are saving the full responses, the file can get large rather quickly if you’re doing a large number of requests. In general, settings such as those shown in Figure 20-6 will be sufficient; however, if you are debugging issues with requests or responses, it can be useful to save the request and/or response headers and the full response data. We’ll describe how to view the output data momentarily, in the section “Reading Test Results.”
Tests can be run either by opening the test in the JMeter GUI and clicking on the Play button in the toolbar, or from the command line. If you’re running the test from a remote server, simply run the following:
$ /path/to/jmeter/bin/jmeter -n -t /path/to/test/loadtest.jmx
In this command, -n tells JMeter to run in non-GUI mode, and -t tells it the path to the test plan file you want to execute.
Now for the fun part, reading the test results to see how our site performed! There are a number of reports available for reading results, though for an overall picture, the best choice is to use the Summary Report. Add one of these to JMeter by right-clicking on Workbench and then going to Add→Listener→Summary Report. Once that is created, click on the Browse button next to the Filename input, and select the output from your test run. JMeter will load that data and display a summary report, as seen in Figure 20-7.
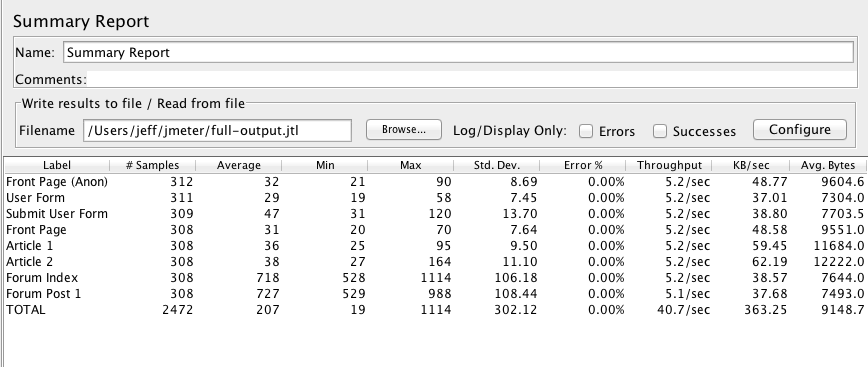
In our case (this was run over a LAN), we can see very fast page load times for all pages on the site. The forum index and forum post are by far the slowest pages, so if we were looking to make improvements, that would be the place to start; however, they are by no means slow at an average load time of around 700 ms.
If you want to dig down into individual requests, you can use the listeners View Results in Tree or View Results in Table, which allow you to click on each individual request to see the details. As we mentioned earlier, this can be a good way to troubleshoot errors with the test—for example, if your login isn’t working properly, you could use these listeners to track the headers sent and received in order to debug what might be going wrong.
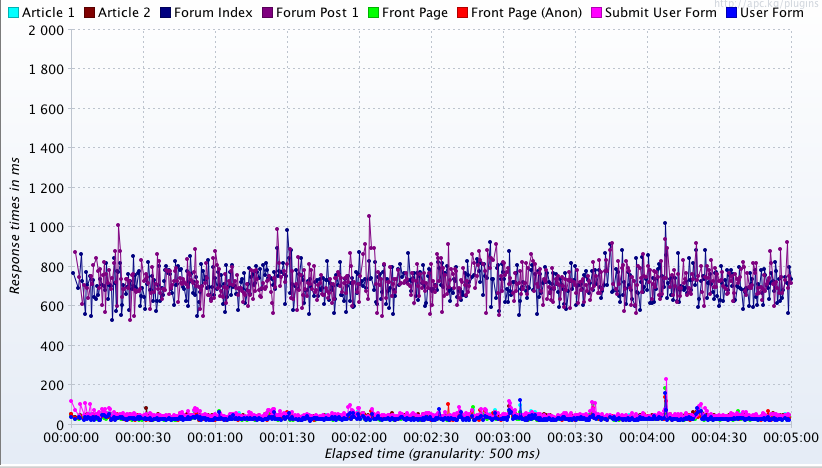
In addition to the built-in listeners, there are some great third-party plug-ins that provide a nice set of graphs for viewing things such as latency (time to first byte) and full page load time within your results. We highly recommend using jmeter-plugins—specifically, the graphs for Response Latencies over Time and Response Times over Time are very useful for visualizing how the page load times vary for different pages throughout the test. Figure 20-8 shows an example of the response times graph for our test—here, it’s easy to see the performance difference between the forum pages and the rest of the site.
Get High Performance Drupal now with the O’Reilly learning platform.
O’Reilly members experience books, live events, courses curated by job role, and more from O’Reilly and nearly 200 top publishers.

