Chapter 1. Introduction to Android Performance
Performance can mean a lot of different things to different people. When it comes to mobile apps, performance can describe how an app works, how efficiently it works, or if it was enjoyable to use. In the context of this book, we are looking at performance in terms of efficiency and speed.
From an Android perspective, performance is complicated by thousands of different devices, all with different levels of computing power. Sometimes just getting your app to run across your top targeted devices feels like an accomplishment on its own. In this book, I hope to help you take your app a step further, and make it run well on 19,000 different Android devices, giving every user the ultimate experience for your Android app.
In this book, we will look at app performance specifically in terms of power management, efficiency, and speed. We will cover the major issues mobile app developers face, and explore tools that will help us identify and pinpoint performance issues typically found in all mobile apps. Once the tools help us isolate the issues, we’ll discuss potential remedies.
Tip
This book should be useful to anyone whose team is developing Android apps. Performance leads, single developers, and teams of developers and testers will all find benefits from the various performance tools and techniques discussed in the following chapters.
As with all suggestions to make your code optimized, your mileage may vary. Some fixes will be quick and easy wins. Other ideas may require more work, code refactoring, and potentially major architectural changes to your mobile app. This may not always be feasible, but knowing where your app’s weaknesses are can help you as you iterate and improve your mobile app over time.
By learning the techniques to benchmark the performance of your app, you will be ready to profile when you feel like there is an issue. Knowing the tricks to improve the efficiency, performance, and speed of your app can help you avoid slowdowns and customer complaints.
Performance Matters to Your Users
How fast does your app have to be? Human engagement studies (going back to the 1960s) have shown that actions that take under 100 ms are perceived as instant, where actions that take a second or more allow the human mind to become distracted.1 Delays and slowness in your app (even if just the perception of slowness) is probably one of the biggest killers of app engagement out there. It can also potentially damage your customers’ phones (a study in 2012 found that slow apps caused 4% of users to throw their phone!2).
Ecommerce and Performance
Imagine an ecommerce app that has collected analytics showing the average shopping session is 5 minutes long, and each screen load takes an average of 10 seconds to complete. Your screen view budget per session is 30 views to complete a sale. If you are able to lower the load time of each view by 1 second, you have added 3 more screen views to the average session. This could allow your customers to add more items to their cart, or perhaps just complete the entire transaction 30 seconds faster!
This completely made up scenario is actually backed by real-world data. A study in 2008 on desktop websites show that slower websites have fewer page views/sales and lower customer satisfaction than faster sites.3
In fact, my fictional ecommerce site improvements match the Figure 1-1 data exactly. By adding 3.3 page views to a session, we added 11% more page views!
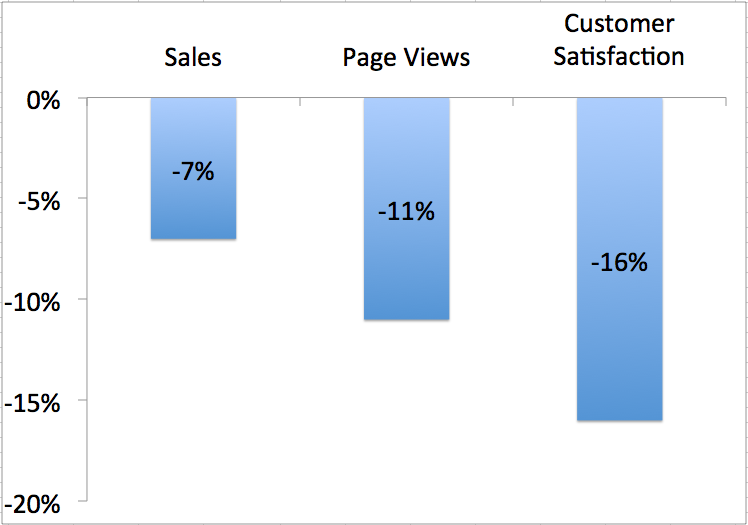
Figure 1-1. Effects of slow websites (based on a 1-second web page delay)
Performance studies on web performance provide a lot of context to mobile app performance. There are many studies showing that speeding up website performance increases engagement and sales. I would argue that all desktop performance results hold for mobile (and due to the instant gratification of mobile, they may even be low estimates).
Amazon4 and Walmart5 have independently reported similar statistics. Both major retailers found that just 100 ms of delay on their desktop web pages caused their revenue to drop by 1%. Shopzilla rearchitected its website for performance, and saw page views increase by 25% and conversions increase by 7%–12%,—all while using half the nodes previously required!6
Beyond Ecommerce Sales
In addition to decreased sales and revenue, mobile apps with poor performance receive lower rankings in Google Play. Even worse are the stories of badly behaved apps being pulled from consumer devices. In 2011, T-Mobile asked Google to remove YouMail, a third-party voicemail app, from what was then called the Android Market. The way YouMail checked for new voicemails on the server was to wake up the device and poll at 1-second intervals (yes, that’s 3,600 pings/hour)! This frequent connection caused an install base of ~8,000 customers to generate more connections on the network than Facebook! Arguably, this all occurred prior to widespread usage of Google Cloud push messaging. But apps with similar behavior are still in Google Play today, and as we will see, they have detrimental performance effects on servers, networks, and most importantly—our customers’ Android devices.
Sometimes your architecture is good enough for launch, but what happens when you get bigger? What if your app gets an ad placed during the next Super Bowl? Is your app/server architecture ready for fast exponential growth?
Performance Infrastructure Savings
Most Android apps are highly interactive and download a lot of content from remote servers. Lowering the number of requests (or reducing the size of each request) can yield huge speed improvements inside your app, but it will also yield huge reductions in traffic on your backend—allowing you to grow your infrastructure at a less rapid (expensive) pace. I have worked with companies that have reduced the number of requests by 35%–50% and the data traffic by 15%–25%. By reducing the work being done remotely, millions of dollars per year were saved.
The Ultimate Performance Fail: Outages
A study of Fortune 500 companies has shown that in 2015, website outages cost companies between $500,000–$1,000,000 per hour. In addition to loss of revenue, there are costs to bring data centers, cloud services, databases, etc. back up. Looking back over the last decade, there have been multiple studies7 estimating the costs of an outage (and they are rising). Two of these studies attribute 35%–38% of outage costs to lost revenue. If we apply that model to all of the studies, we find that a one hour outage causes a $175K loss in revenue per hour in 2015, and the costs are just getting higher (Figure 1-2).
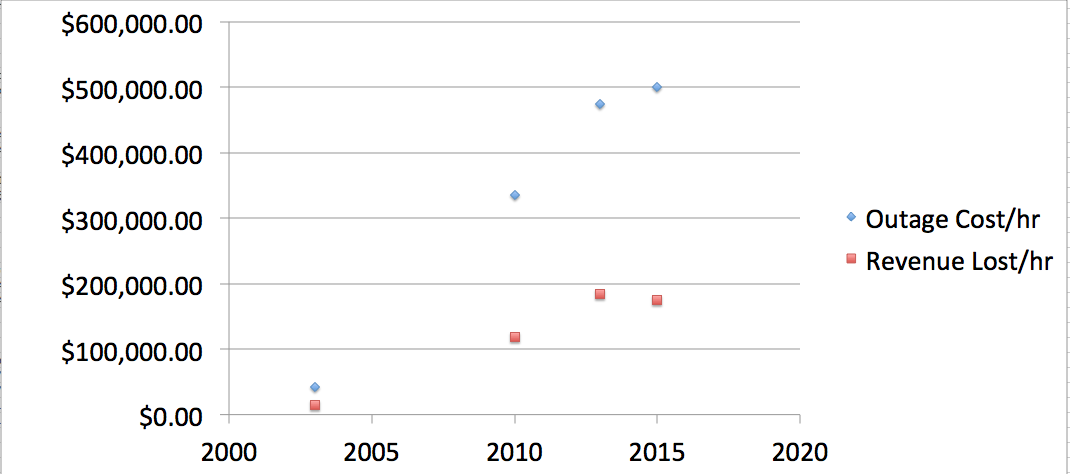
Figure 1-2. Cost of an outage per hour
An outage is certainly the worst type of performance issue. Nothing works! For this reason, companies spend millions of dollars a year to prevent complete outages of their content. In addition to loss in revenue and customer satisfaction, when there is an outage, our customers also have no idea how to react (see Figure 1-3).
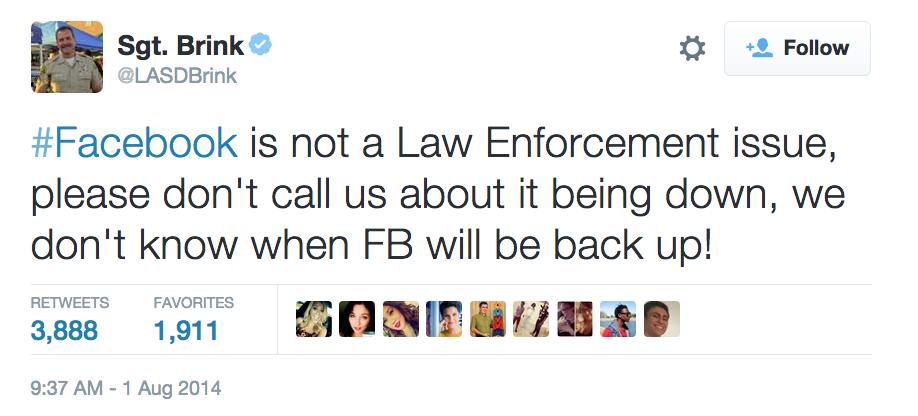
Figure 1-3. Sgt. Brink of the Los Angeles County Sheriff’s Department tweeted an advisory in response to a high volume of inquiries regarding a Facebook outage
But in all seriousness, uptime performance is crucial to the survival of your company. The mobile analogy to an outage is when your app crashes. Obviously, the first performance issue you must resolve are crashes, because if the app doesn’t work, it doesn’t matter how fast it is. However, when your app is running slower or even appears to be slower, your customers will have a similar reaction to when there is an outage.
Performance as a Rolling Outage
When there is a brownout, your electric company is providing a lower voltage, and your lights appear dim (and your fridge might stop working altogether). A slow Android app operates in the same way. Your customers can still use your app, but scrolling may be laggy, images may be slow to load, and the whole experience feels slow. Just as a brownout adversely affects an electric company’s customers, a slow Android app is equivalent to a rolling ongoing outage. In March 2015, HP published “Failing to Meet Mobile App User Expectations”, a study that shows customers react to slow apps the same way they do to apps that crash (Figure 1-4).
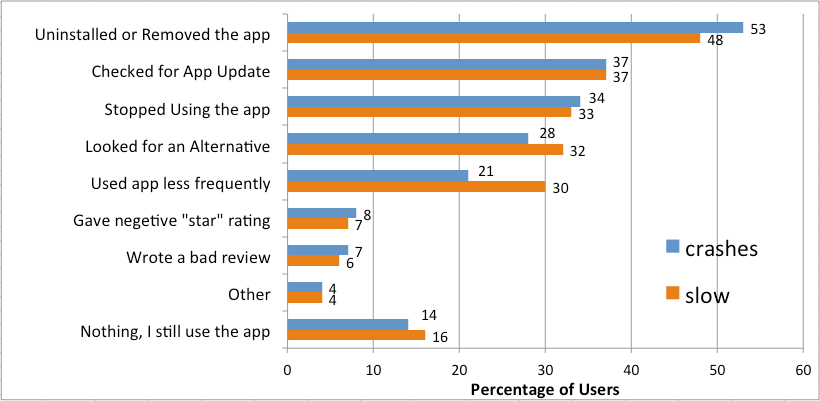
Figure 1-4. Poor performance versus crashes: same consumer result
If we cross reference the data from the “Performance Matters to Your Users” section with the data from the “The Ultimate Performance Fail: Outages” section, we can come up with estimates of the cost of slow performance (Figure 1-5). When there is an outage, your app loses revenue.8 If we know that after 4.4 s of load time, conversions drop 3.5%–7%, we can estimate that a slow “rolling outage” costs your bottom line as much as $6K–$12K per hour.
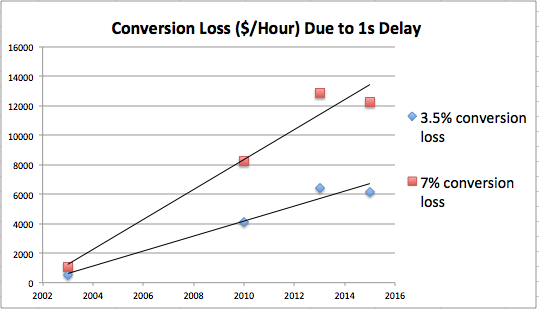
Figure 1-5. Cost of a slow app per hour (based on a 1-second web page delay)
As Figure 1-5 shows, the cost of a slow app is increasing year over year. As your app loses revenue and customers, eventually your revenue will drop to zero—which is something I hope never happens to your app.
Consumer Reaction to Performance Bugs
With such a complicated development platform, it is inevitable that some bugs will slip through your testing processes and affect customers. A recent study showed that 44% of Android app issues and bugs were discovered by users, and 20% of those were actually reported to developers by users who submitted feedback in Google Play reviews.9 Negative reviews are not the way you want to discover issues. Not only is one customer frustrated, but all of your future potential customers will have the ability to see your dirty laundry when they look at the reviews. When customers see reviews discussing bugs and problems with your app, they may decide to not continue the download. Anything that prevents your app from being downloaded is costing you money!
Once the app has been downloaded, you are not out of the woods. In 2014, 16% of downloaded Android apps were launched only once.10 Customers are easily distracted, and with so many choices in the app markets, if your app doesn’t satisfy, they will quickly try a similar app. Although there are many reasons why users abandon apps, it can be argued that being frustrated with an app is a top reason to abandon or uninstall. According to a study by Perfecto Mobile,11 the top user frustrations are as follows:
-
User interface issues (58%)
-
Performance (52%)
-
Functionality (50%)
-
Device compatibility (45%)
While performance is directly called out as the number two reason for customer frustration, it is clear that the other responses also have aspects of performance to them. It becomes pretty clear that the major reasons customers stop using apps are due to issues related to performance.
Adopting a minimum viable product (MVP) approach to your Android app—where the initial launch contains bugs and performance sinks—assumes that when the fixes are made, you:
-
Still have an audience
-
They update your app
-
They launch the updated app to see the improvements
Twitter has reported that it takes 3 days for 50% of users to upgrade its Android app, and 14 days for 75% of users to update to the latest version.12 The company found this to be extremely repeatable. So if your app is not uninstalled, you still have to hope that your updates (with all your fixes and improvements) are:
-
Actually downloaded by users
-
Opened up so that the fixes are seen
Smartphone Battery Life: The Canary in the Coal Mine
The studies discussed in the previous section show that consumers prefer fast apps, and apps that do things quickly. One of the top concerns of smartphone owners is battery life. While it is not (yet) common knowledge to customers, apps (and especially non-optimized ones) can be a major factor in battery drain. I use my end-of-day battery percentage as an indicator of how apps are performing on my phone. If I notice a sudden dip in battery life, I begin to investigate recently downloaded apps for potential issues.
One common refrain in new Android device reviews is that “battery life is not improved from <previous model>.” My contention is that if these reviewers set up their new devices with the same apps that were on their previous devices, battery life would be similar. One of his or her cherished apps that was moved to the new phone is killing the battery. In Chapter 3, we’ll show how battery drain of the mobile device can be used as a proxy for application performance, and how improving the performance of your app will extend battery life for your customers.
The top drainers of mobile battery are the screen, the cellular and Wi-Fi radios, and other transmitters (think Bluetooth or GPS). We all know that the screen has to be on to use apps, but the way your mobile app utilizes the other power-draining features of a mobile device can have huge effects on battery life.
Consumers have typically blamed their devices, the device manufacturers, or the carriers for device battery issues. This is no longer the case. In fact, 35% of consumers have uninstalled an app due to excessive battery drain.13 Consumer tools that display how apps drain the battery are only just now coming to market, but the quality of these tools is radically improving. Thankfully, the tools for developers to minimize power drain are also beginning to surface, and we’ll explore these tools in Chapter 3. It is best to be as conscientious as possible regarding battery and power concerns while architecting and building your mobile apps.
Testing Your App for Performance Issues
The best way (prelaunch) to discover performance issues is to test, test, and test some more. In Chapter 2, I’ll cover the devices you should use for testing in order to cover as much of the Android ecosystem as possible. In subsequent chapters, I’ll walk through many of the tools available to help you diagnose performance issues, and tips to resolve them. Once you are in market, ensure that your app reports back to you on usage patterns and issues that your customers are facing. Read these reports, and dissect the information so that you can resolve issues discovered in the field.
There are two common areas of performance testing: synthetic and real user monitoring (RUM).
Synthetic Testing
Synthetic tests are created in the lab, to test specific use cases, or perhaps to mimic user behaviors in your mobile app. Many of the tools we’ll discuss in future chapters run with synthetic tests, where you as a developer run your app through its paces and look for anomalies. This is a great way to discover and resolve many bugs and performance issues. However, given that Akamai reports 19,000 unique Android user agents per day,14 there is no way you can possibly run a synthetic test for every possible scenario.
Real User Monitoring (RUM)
Testing every device scenario is impossible in the lab, so it is essential to collect real performance data from your customers. By inserting analytics libraries into your app, you can collect real-time data from all of your users—allowing you to quickly understand the types of issues they might be facing. This gives you the chance to respond to customer issues and bugs that are discovered in the field. Of course, once resolved, it is smart to find ways to replicate such issues in the lab—to avoid future releases with issues. Chapter 8 will walk through some typical results you obtain from RUM tools.
Conclusion
The evidence presented in this chapter conclusively shows that the performance of your app—load speeds, scrolling actions, and other user events—must be fast and smooth. A slowly performing app results in loss of customers at a rate similar to apps that crash. For that reason, having a poorly performing app is like operating with rolling outages. You’ll lose engagement, sales, and ultimately your customers (both current and future). So, now that you are convinced (and once you’ve used this data to convince your managers and senior leadership, too!), let’s go solve all your performance issues and get your app running fast!
1 Jakob Nielsen, “Response Times: The 3 Important Limits,” excerpt from Usability Engineering (1993), http://www.nngroup.com/articles/response-times-3-important-limits/.
2 Mobile Joomla!, “Responsive Design vs Server-Side Solutions,” December 3, 2012, http://www.mobilejoomla.com/blog/172-responsive-design-vs-server-side-solutions-infographic.html.
3 Roger Dooley, “Don’t Let a Slow Website Kill Your Bottom Line,” Forbes, December 4, 2012, http://www.forbes.com/sites/rogerdooley/2012/12/04/fast-sites/.
4 Todd Hoff, “Latency Is Everywhere And It Costs You Sales - How To Crush It,” High Scalability, July 25, 2009, http://highscalability.com/latency-everywhere-and-it-costs-you-sales-how-crush-it.
5 Joshua Bixby, “4 Awesome Slides Showing How Page Speed Correlates to Business Metrics at Walmart.com,” Radware, February 28, 2012, http://www.webperformancetoday.com/2012/02/28/4-awesome-slides-showing-how-page-speed-correlates-to-business-metrics-at-walmart-com/.
6 Todd Hoff, “Latency Is Everywhere.”
7 Yevgeniy Sverdlik, “One Minute of Data Center Downtime Costs US$7,900 on Average,” DatacenterDynamics, December 4, 2013, http://www.datacenterdynamics.com/critical-environment/one-minute-of-data-center-downtime-costs-us7900-on-average/83956.fullarticle;
Martin Perlin, “Downtime, Outages and Failures - Understanding Their True Costs,” Evolven, September 18, 2012, http://www.evolven.com/blog/downtime-outages-and-failures-understanding-their-true-costs.html;
AppDynamics, “DevOps and the Cost of Downtime: Fortune 1000 Best Practice Metrics Quantified,” http://info.appdynamics.com/DC-Report-DevOps-and-the-Cost-of-Downtime.html.
8 Some customers will come back and buy later, so this is a low estimate of revenue per hour.
9 Perfecto Mobile, “Why Mobile Apps Fail: Failure to Launch,” Fall 2014, http://info.perfectomobile.com/rs/perfectomobile/images/why-mobile-apps-fail-report.pdf.
10 Dave Hoch, “App Retention Improves - Apps Used Only Once Declines to 20%,” Localytics, June 11, 2014, http://info.localytics.com/blog/app-retention-improves.
11 See the “Why Are Your Mobile Apps Failing?” infographic.
12 See “Scaling Android Development at Twitter”, a presentation by Twitter’s Jan Chong at Droidcon Paris 2014.
13 Hewlett-Packard, “Failing to Meet Mobile App User Expectations: A Mobile User Survey - Dimensional Research,” http://bit.ly/1LXYPec.
14 Alec Heller, “UA Strings Are Terrible: Adventures in Server-side Device Characterization for Site Performance,” Velocity 2014: Building a Fast and Resilient Business, June 25, 2014, http://velocityconf.com/velocity2014/public/schedule/detail/35211.
Get High Performance Android Apps now with the O’Reilly learning platform.
O’Reilly members experience books, live events, courses curated by job role, and more from O’Reilly and nearly 200 top publishers.

