Chapter 9. Charts: Graph your data

Who wants to look at numbers all the time?
Very often a nice graphic is a more engaging way to present data. And sometimes you have so much data that you actually can’t see it all without a nice graphic. Excel has extensive charting facilities, and if you just know where to click, you’ll unlock the power to make charts and graphs to display your data with drama and lucidity.
Head First Investments needs charts for its investment report
There is a big presentation coming up for Head First Investment’s board of directors. They have all the data compiled to show their performance over the last year, but they need some charts to make the data easier to read and understand. It’s up to you to crank out some attractive charts.

Sharpen your pencil
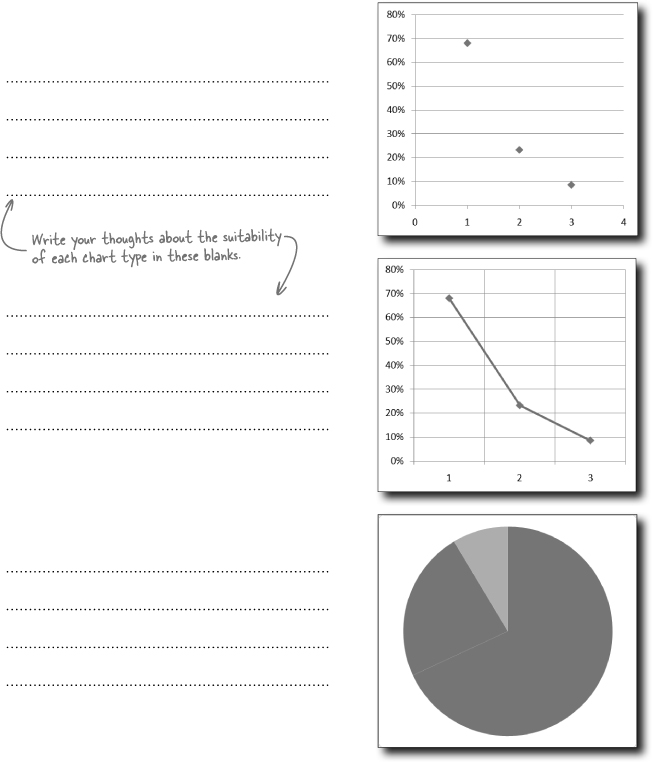
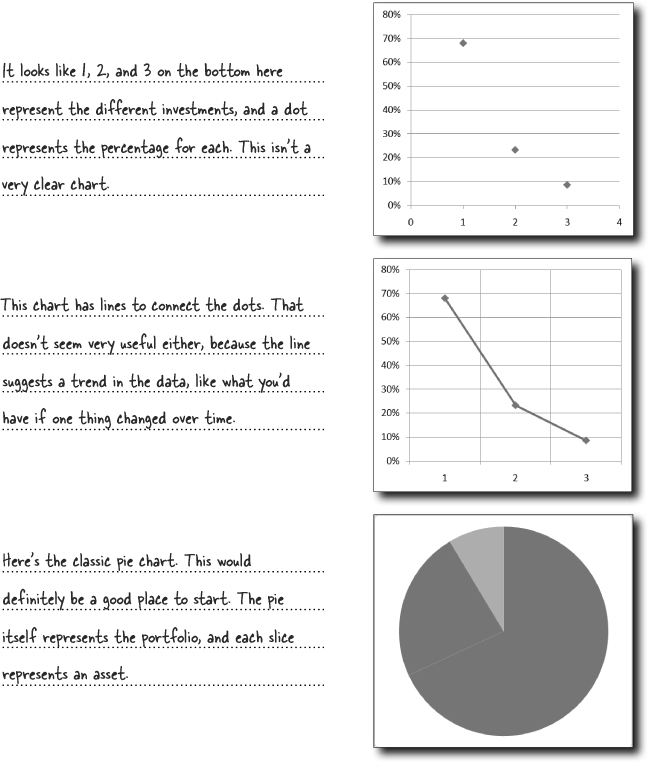
Look at each chart type. Which is most appropriate to show portfolio allocation?
Sharpen your pencil Solution
Which chart did you conclude would be the most useful way of representing your company’s portfolio visually?
Create charts using the Insert tab
Let’s ...
Get Head First Excel now with the O’Reilly learning platform.
O’Reilly members experience books, live events, courses curated by job role, and more from O’Reilly and nearly 200 top publishers.

