
The details of your data are tantalizing.
But only if you know how to look at them. In this chapter, you’ll forget about formatting and functions and just focus on how to change your perspective on your data. When you are exploring your data, looking for issues to investigate, the sort, zoom, and filter tools offer surprising versatility to help you get a grip on what your data contains.
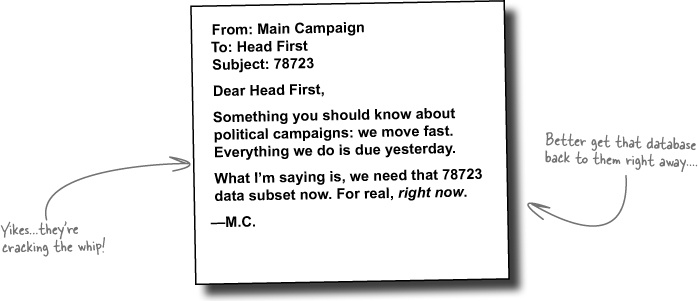
The Main Campaign is working for the Dataville mayor and wants to solicit his supporters for money.
Your client is a super-intense, super-demanding politico. But the good news is that the data is pretty clean (that’s always a relief!), and if you can help this group organize their contributor list, you’ll have scored a huge account.
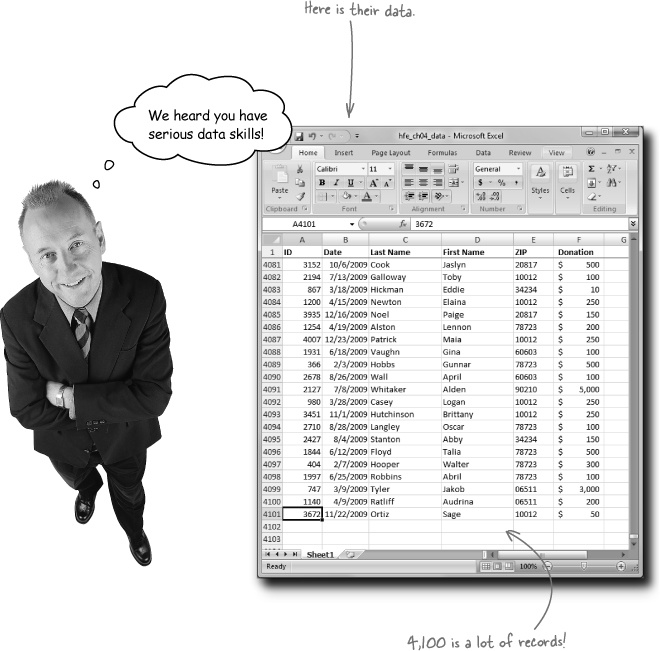
The data is a list of their contributors’ donations from the past year. And while the data is of a high quality, at over 4,000 rows, there’s quite a lot of it!
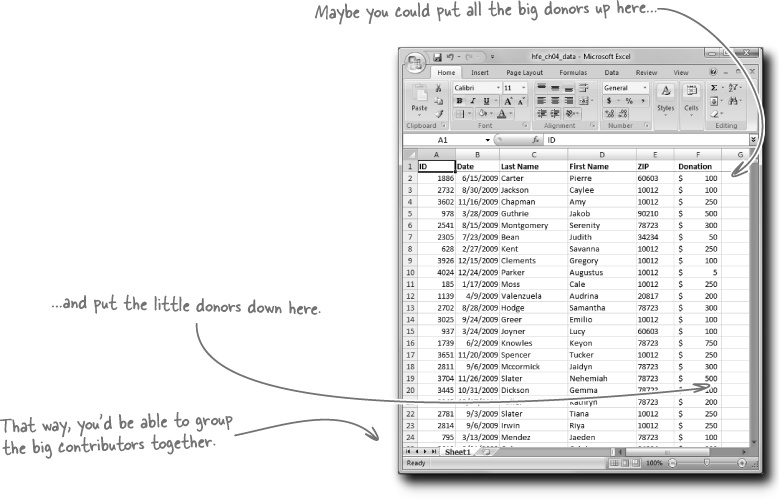
Getting in touch with their most passionate (that is, most generous!) contributors is a big deal. The small fries are important, but before anything else, the Main Campaign needs to get in touch with the big contributors.

Sharpen your pencil
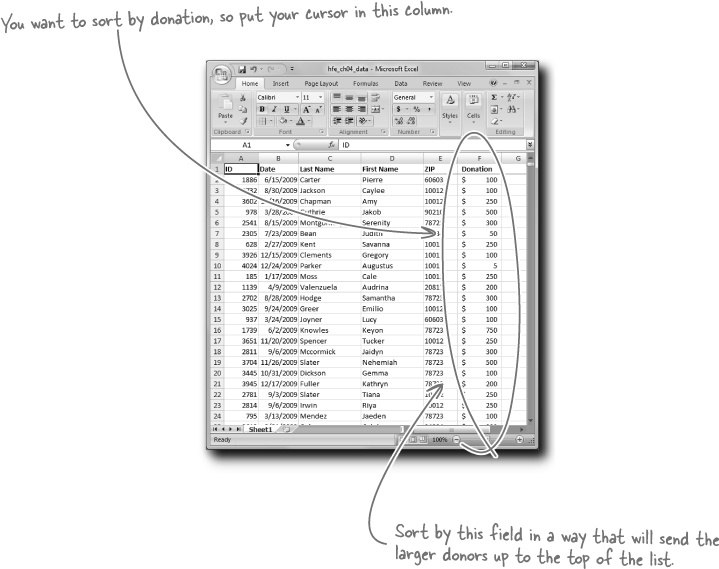
Take a look at your data. How could you change your perspective on it to show you the top donors?
____________________________________________________
____________________________________________________
____________________________________________________
____________________________________________________
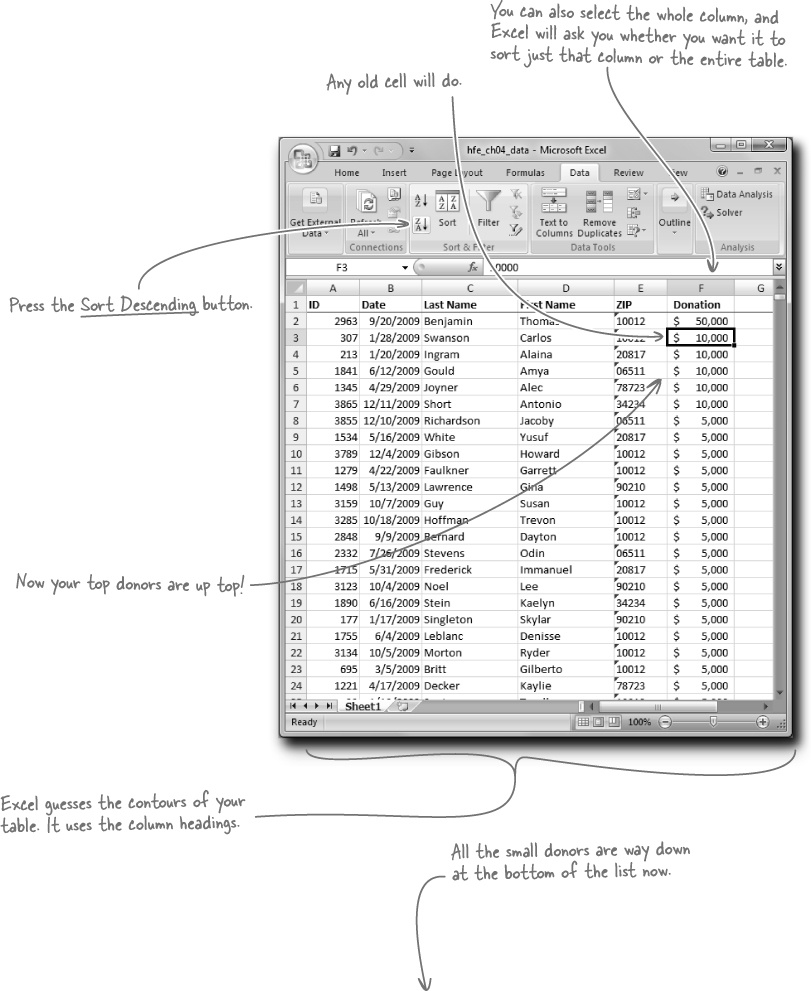
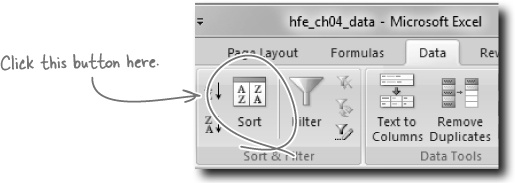
The Sort buttons are a useful tool that enables you to reshuffle the order of the rows in your data. The Sort buttons can be found under the Data tab of the Ribbon.
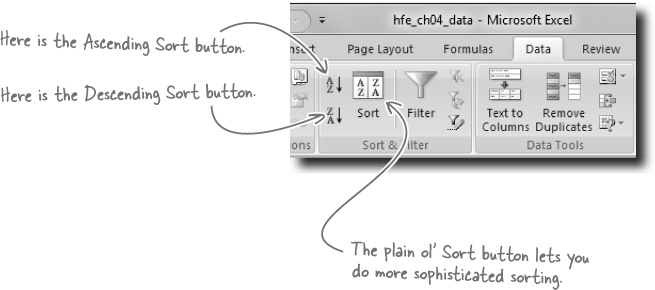
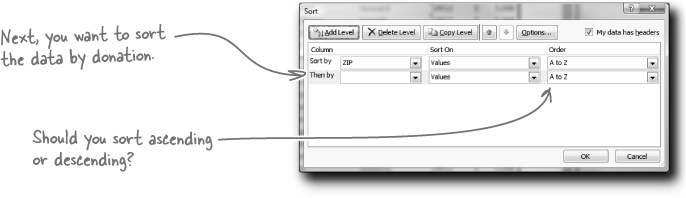
To sort ascending means to order your data from first to last or smallest to largest, and to sort descending means to do the opposite.
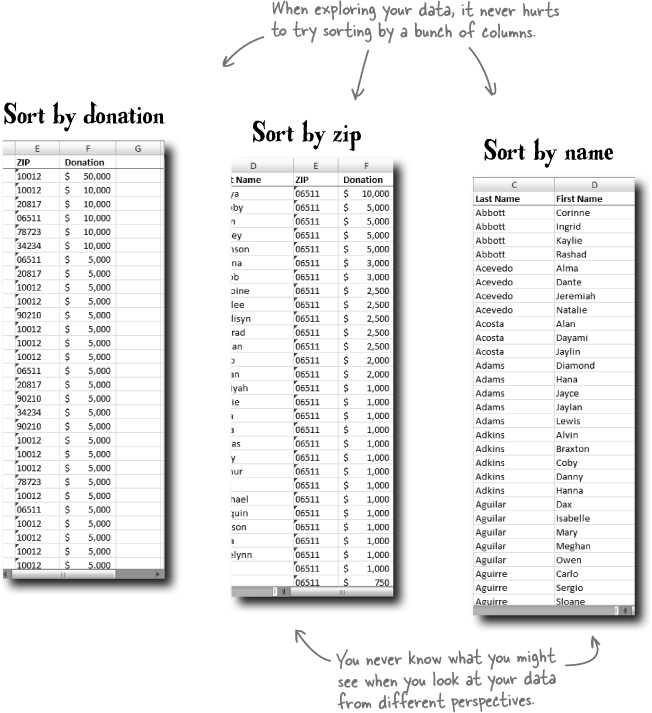
There are many occasions where you’ll want to use Sort to change the order of your data, but Sort is especially useful when you’re looking at data for the first time and trying to get a feel for what’s in it.
When you look at data for the first time, it’s a good idea to sort by different columns to look for visible patterns.
Watch it!
Excel can figure out which columns are in your table...usually.
If Excel doesn’t sort all your columns together, it can wreck your database. Always save your data first and check it after sorting to make sure you and Excel got it right.
Let’s see what the Main Campaign has to say about this newly organized data....
Exercise
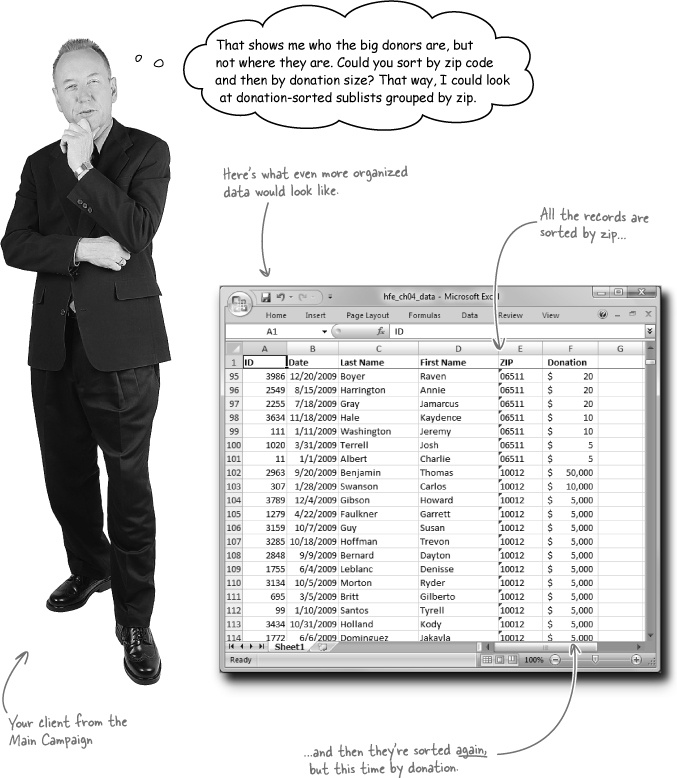
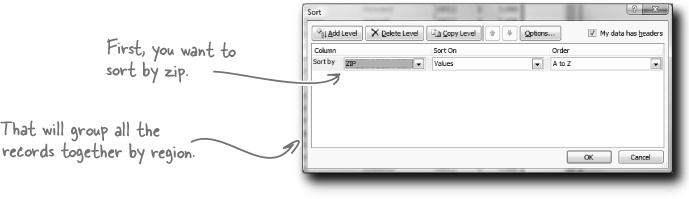
Let’s see if we can fulfill the client’s request: first to sort the data by zip code, and then to sort it by donation. This sort will enable us to look at the biggest givers by grouping them by geography.
To execute this new and more complex sort, start by clicking the big Sort button. (Be sure your cursor is inside your data table first.)
In the dialog that pops up, start by telling Excel to sort your data by zip.
Now click Add Level and add a new level to sort by donation. You may receive a warning dialog box...just do what you think is best.
Exercise Solution
Were you able to sort the data by zip and then donation?
To execute this new and more complex sort, start by clicking the big Sort button. (Be sure your cursor is inside your data table first.)
In the dialog that pops up, start by telling Excel to sort your data by zip.
Now click Add Level and add a new level to sort by donation. You may receive a warning dialog box...just do what you think is best.
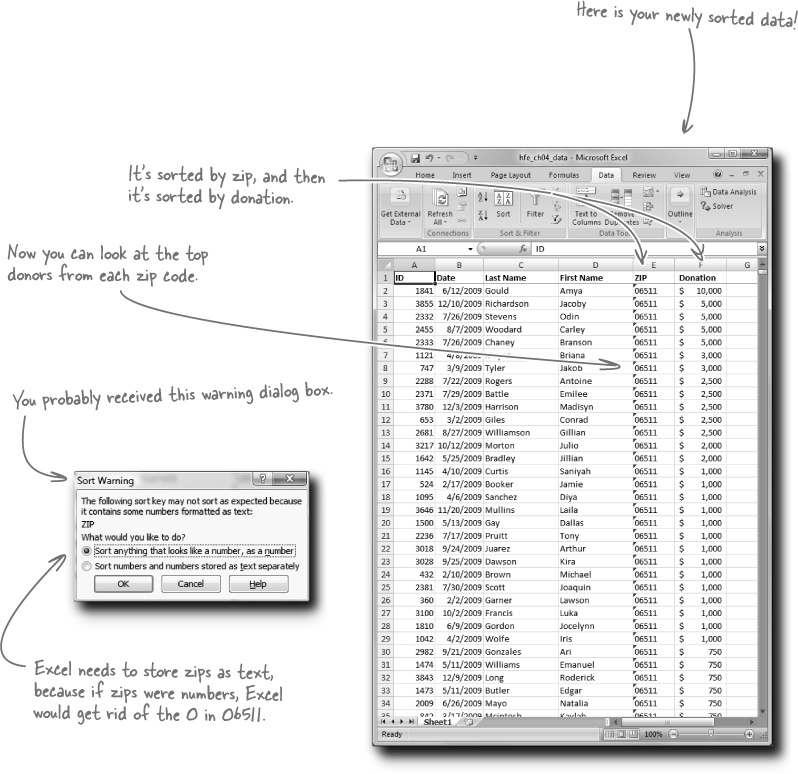
Nice work on sorting that data.
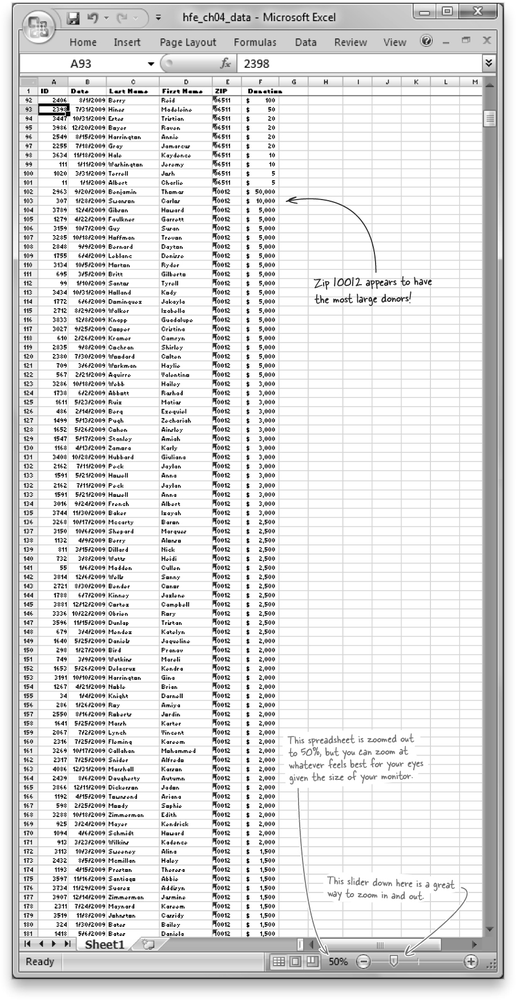
Now you can see how many large donations fall into each zip. Let’s see what the client thinks....
Looking at the data is a good thing. It’s a nonobvious but important part of data analysis, and your client is right to want to be able to see the data better, not just group it correctly. What should you do?
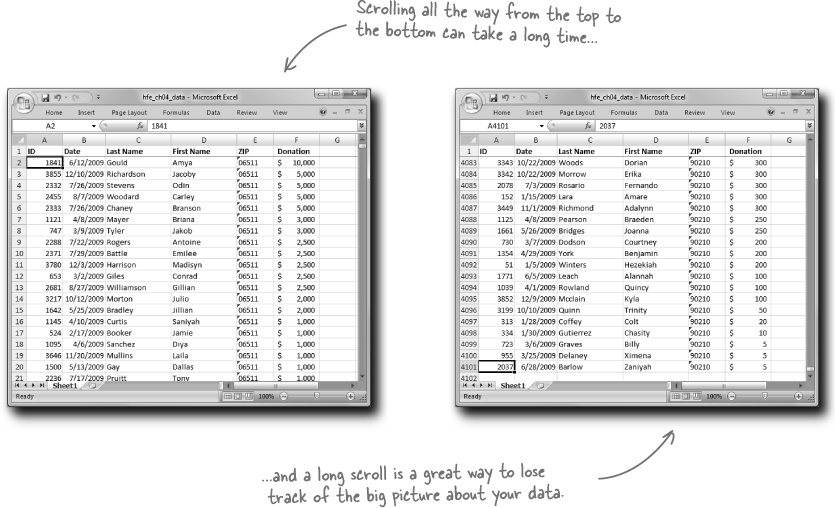
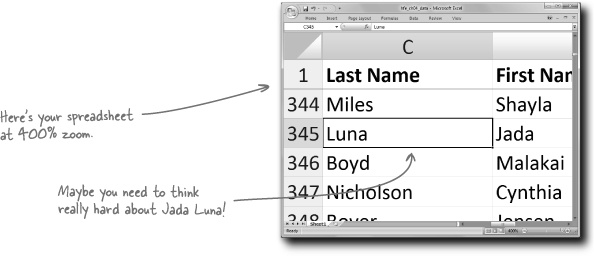
Sometimes you need to focus on a small part of your data. Why not zoom way in?
Sometimes you need to focus on the big picture. In that case, zoom way out.
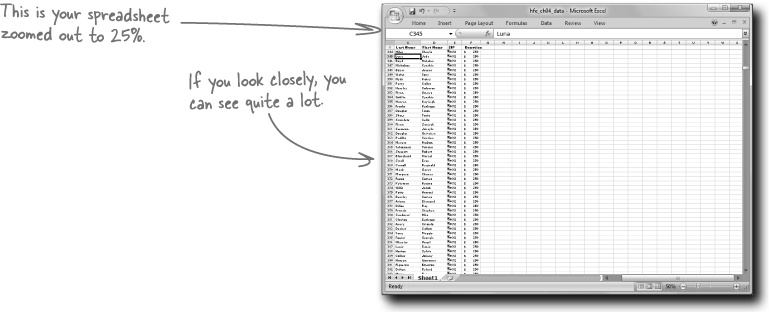
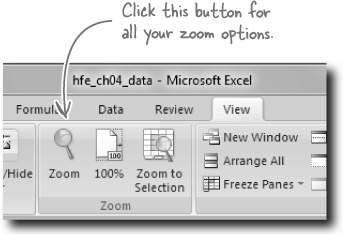
Getting the big picture through zooming out is not about straining your eyes (if you feel your eyes strain, you should be zooming in!). It’s about looking at as much of the whole picture of your data as you can see at once. To zoom, click the View tab to get to the Zoom button.

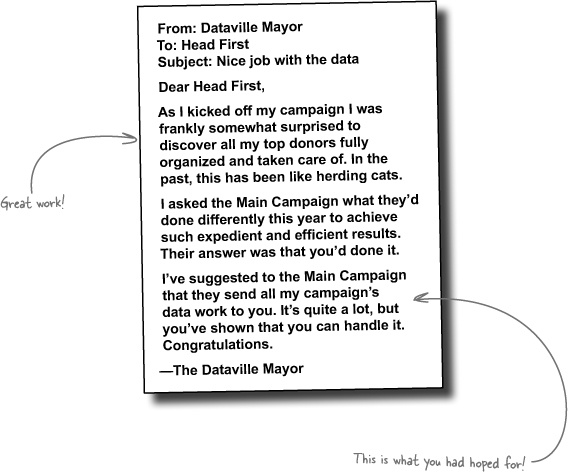
Looks like Mr. Demanding is impressed! Without running any sort of function or doing any sort of formatting, you were able to sort and zoom your way to a greater clarity about his data.
But now he wants to focus on just one subset of the data. You know you can’t just delete the data he doesn’t want to focus on. How can you look at just the data he wants without changing the rest of the data?
Sorting and zooming have given you a rich big-picture perspective, but sometimes you want to look at just a slice of data. Try clicking on the Filter button.
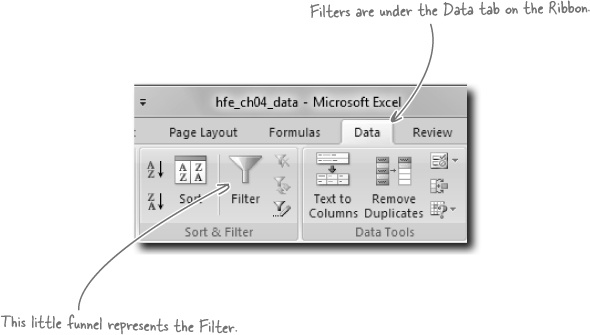
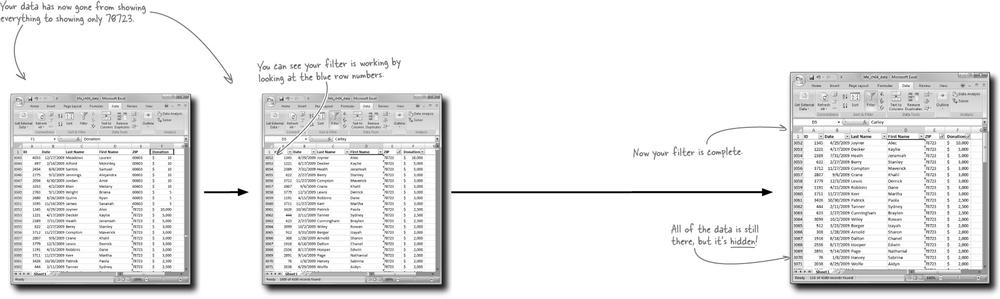
Filters are convenient because they give you a way to hide the data you don’t want to see. It’s still very much there; it’s just conveniently out of the way. And just as with sorting, when you’re exploring a new data set for the first time, it’s a great idea to run filters to look at various subsets of the data.
When you click on the Filter button, Excel puts a drop box on every column in your data table.
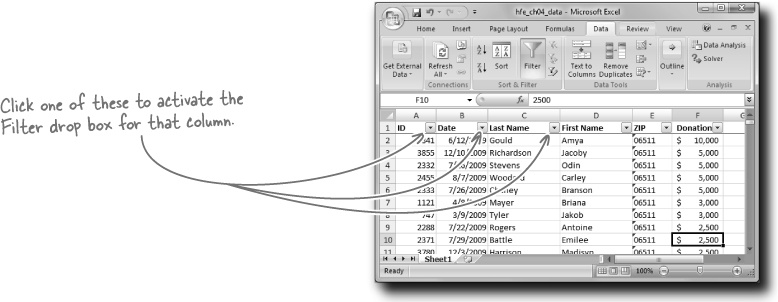
When you click on one of the drop boxes, Excel gives you a bunch of options for filtering the data based on the data in that column.
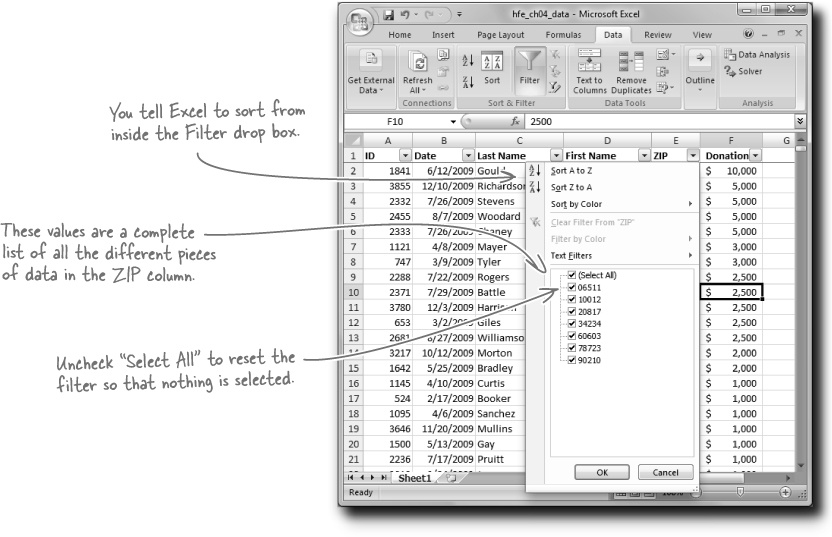
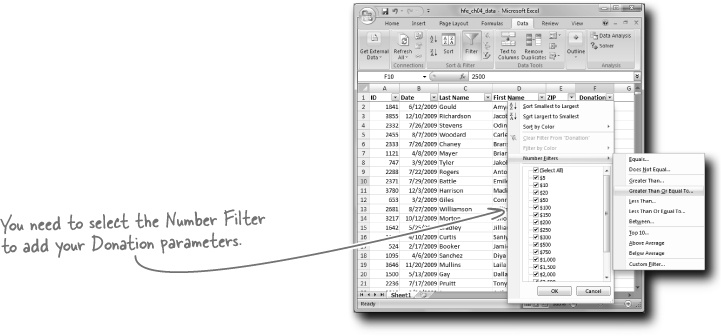
Each of the seven zip codes represented in your data set are listed in the Filter drop box for ZIP. Because they’re all checked, Excel is showing all of them. But you only want to see 78723....
Exercise Solution
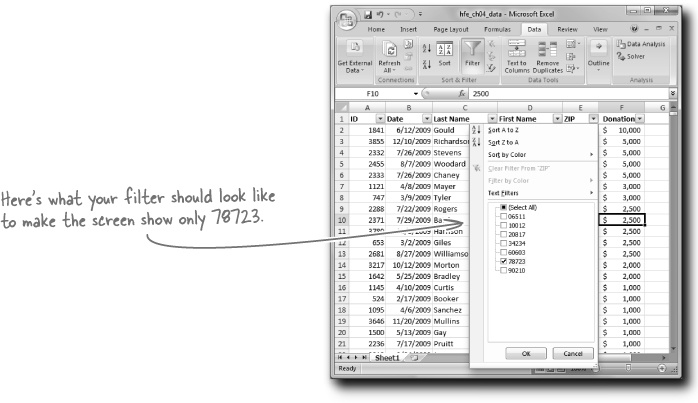
Were you able to apply the filters that show only people from zip 78723 who gave $1,000 or more?
Tell Excel to filter by zip 78723. With the Filter drop box activated for the ZIP field, uncheck the Select All box so that none of the zips is selected. Then select the 78723 zip and press OK.
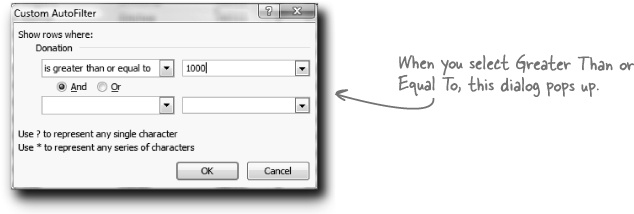
Apply another filter that shows only people with donations of $1,000 or more. Select the Donation filter drop box and then the options that you believe will show you only the individual you want to see.

This is kind of ambiguous.
A guy named Alex who’s a big giver? There could be tons of people in the database named Alex! This could be like finding a needle in a haystack. Except that we have a potent tool: filters.
Exercise Solution
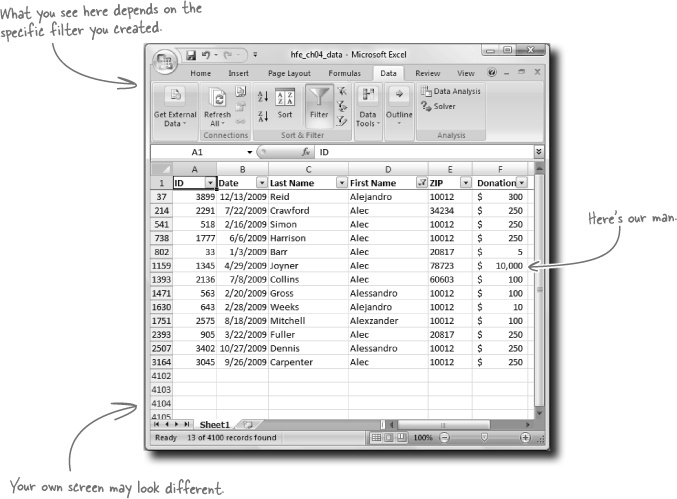
Were you able to dig up this mysterious donor?
Clear your old filter. To do this, click the Filter button twice: first to eliminate the filter, and second to start a new filter.
Use your filter to find Alex!
There’s no Alex, but there’s Alec, Alejandro, and Alessandro. All of them are small givers, except for one of them. There’s an Alec who’s a $10,000 donor. He must be the one!
Get Head First Excel now with the O’Reilly learning platform.
O’Reilly members experience books, live events, courses curated by job role, and more from O’Reilly and nearly 200 top publishers.

