Chapter 11. Error: Err Well

The world is messy.
So it should be no surprise that your predictions rarely hit the target squarely. But if you offer a prediction with an error range, you and your clients will know not only the average predicted value, but also how far you expect typical deviations from that error to be. Every time you express error, you offer a much richer perspective on your predictions and beliefs. And with the tools in this chapter, you’ll also learn about how to get error under control, getting it as low as possible to increase confidence.
Your clients are pretty ticked off
In the previous chapter, you created a linear regression to predict what sort of raises people could expect depending on what they requested.
Lots of customers are using the raise algorithm. Let’s see what they have to say.

What did your raise prediction algorithm do?
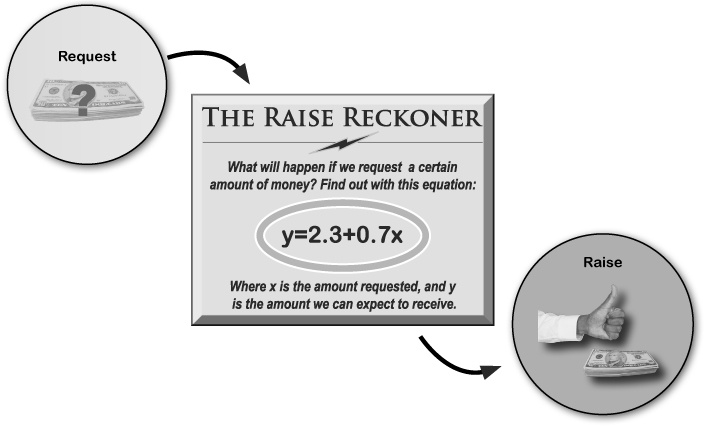
Everyone used the same formula, which was based on solid empirical data.
But it looks like people had a bunch of different experiences.
What happened?
Get Head First Data Analysis now with the O’Reilly learning platform.
O’Reilly members experience books, live events, courses curated by job role, and more from O’Reilly and nearly 200 top publishers.

