Chapter 4. Agile Planning and Estimation: Generally Accepted Scrum Practices
Agile teams use straightforward planning tools to get a handle on their projects. Scrum teams plan their projects together so that everybody on the team commits to each sprint’s goal. To maintain the team’s collective commitment, planning, estimating, and tracking need to be simple and easy for the whole team to do as a group. From user stories and planning poker to velocity and burndown charts, Scrum teams always know what they’ve done and what’s left to do. Get ready to learn the tools that keep Scrum teams informed and in control of what they build!
Meanwhile, back at the ranch...
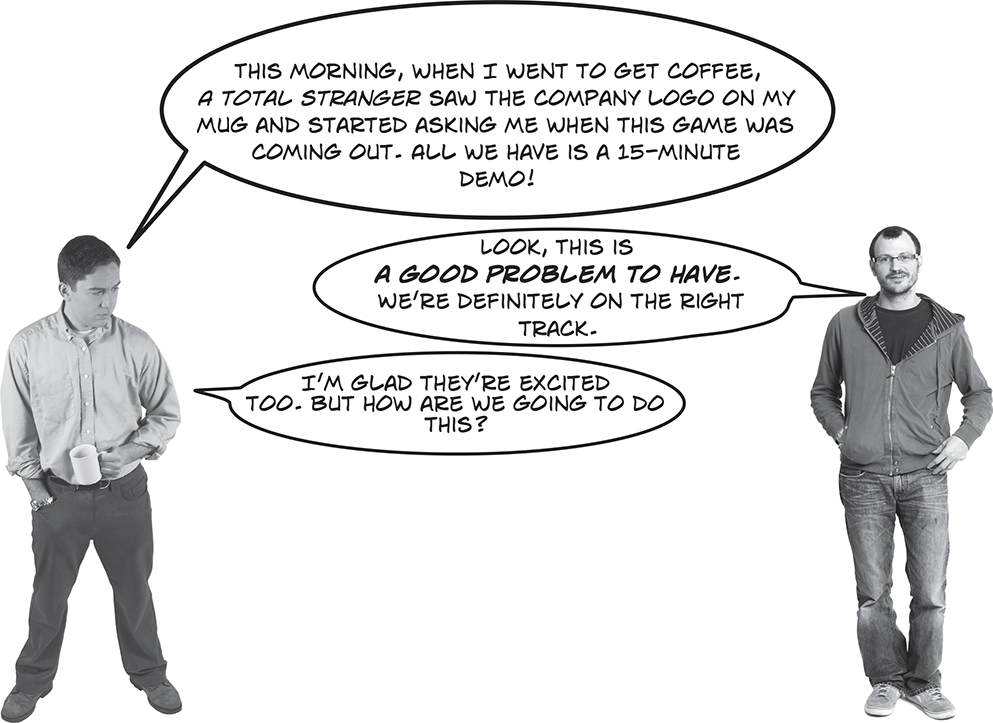
The demo of CGW5 was the most exciting thing at the Wisconsin Game conference. But is the team a victim of their own success? Now it seems like everyone in the gaming world expects it to be the most innovative and fun game of the year. That’s a lot of pressure on the team!
So... what’s next?
The team had enough backlogged requests to build out a crowd-pleasing demo at the beginning of the project. But now they’ve got to make sure that the full-length game will make gamers as happy as the demo did.
Introducing GASPs!
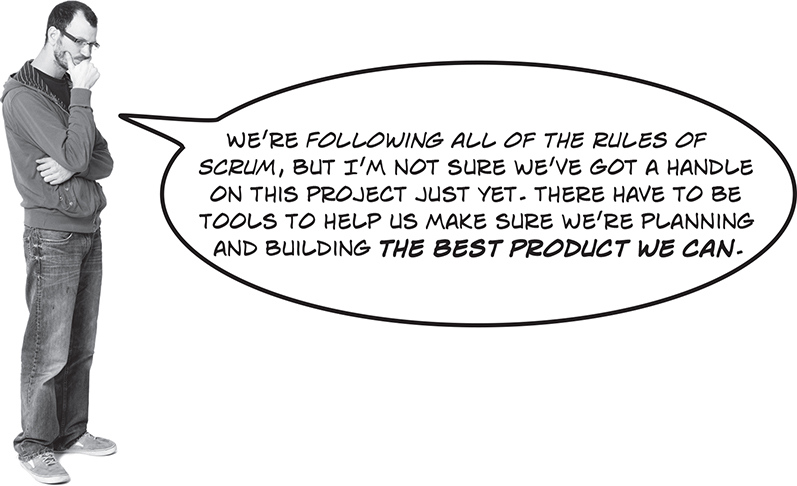
When Scrum teams start working on a sprint, they use tools that include the whole team in setting goals and tracking them. While these practices are not part of the core Scrum rules, they’ve been used by many Scrum teams to plan work and keep everybody on the same page. That’s where the Generally Accepted Scrum Practices —or “GASPs”—come in. They’re not technically part of the Scrum framework, but they’re so common among Scrum teams that they’re found on almost every Scrum project.
1 User stories and story points
User stories help you to capture what your users need from the software so you can build it out in chunks that they can use. Story Points are a way of saying how much effort will be needed to build a user story.
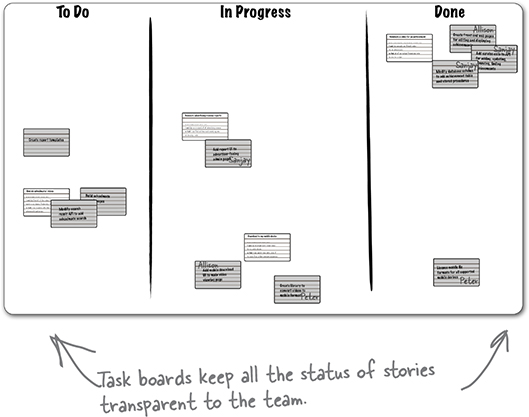
3 Task boards
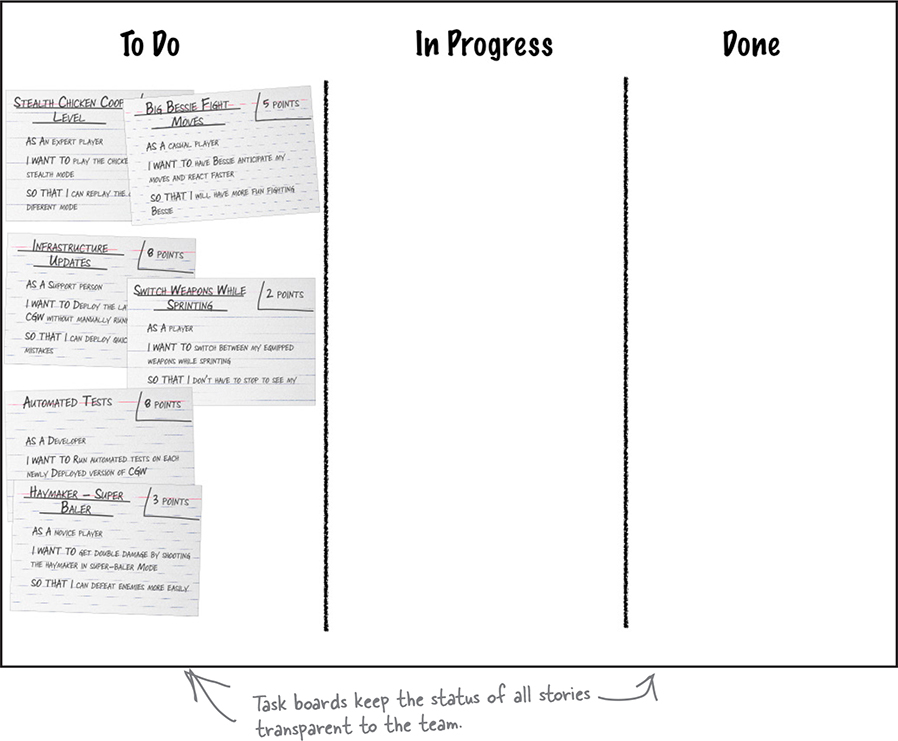
Task boards keep everybody in the team on the same page about the current sprint’s progress. It’s a quick, visual way to see what everybody is doing.
Note
The term GASP was created by leading agile thinker Mike Cohn in a widely read 2012 blog post called “The Rules vs. Generally Accepted Scrum Practices”
https://www.mountaingoatsoftware.com/blog/rules-versus-generally-accepted-practices-scrum
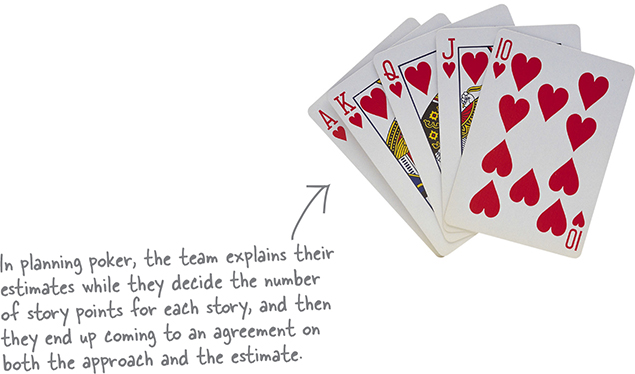
2 Planning poker
Teams use planning poker to get everybody thinking about how big each story is and how they’ll build it.
Note
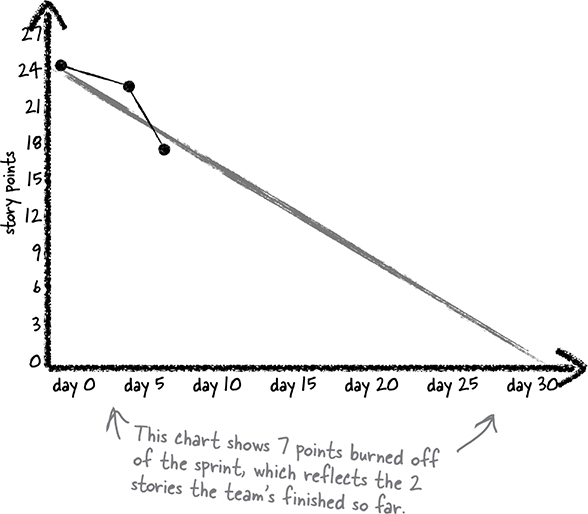
The burndown chart is a great tool for helping you to figure out how much work is left to do, and get a pretty good sense of whether or not you’ll finish all of the work planned for the Sprint.
4 Burndown chart
Everyone on the team can see much work they’ve done and how much is left to do using burndown charts.
No more 300-page specs... please?
The team used to create detailed specifications, because writing up all of the requirements for the game seemed like the most efficient way to communicate everything the users needed. But a lot gets lost in translation when one person tries to write down everything and communicate it to a development team. Is there a better, more agile way to write down requirements?
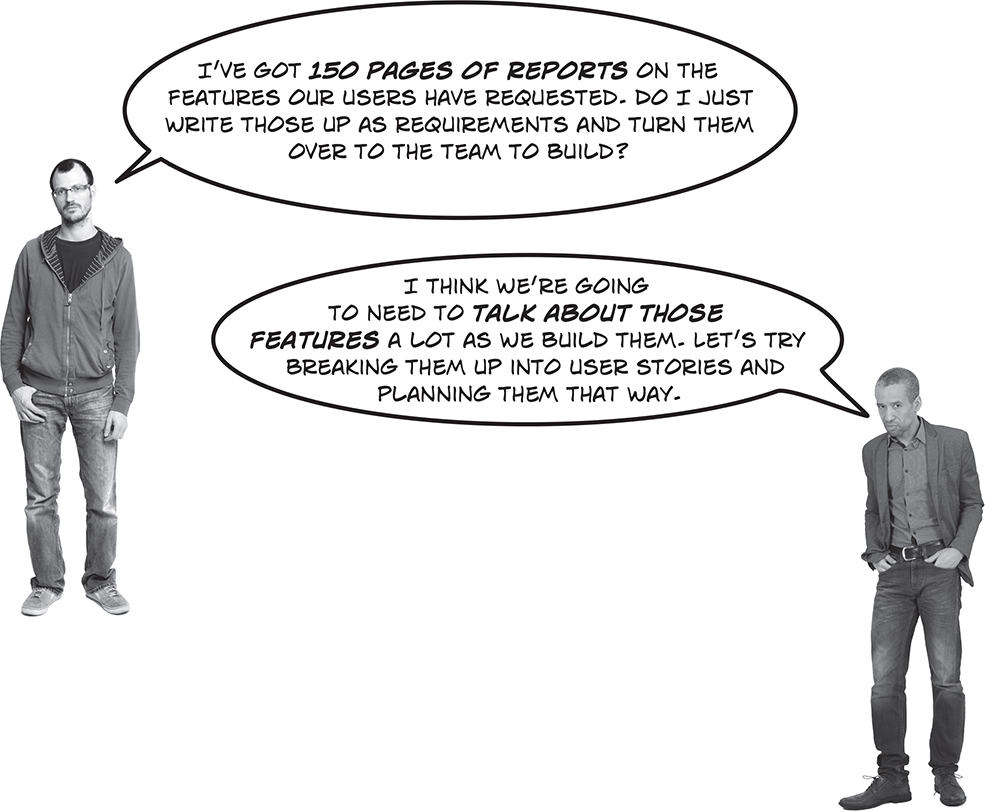
Alex: I was thinking that too. But I need more than just a report of requested features to do that, don’t I?
Rick: Huh, I guess you’re right. It looks like we need to figure out who our users are first, and then divide the list of features into a list of actions and benefits. Do you feel like you have enough information to do that?
Alex: Actually, when I think about it, I do have all of that. There are three kinds of gamers we target with the CGW series: novices, casual gamers, and experts.
Rick: OK, let’s use those roles to write up our stories.
Alex: Yeah, figuring out the actions the users will take is pretty easy. That’s usually the meat of the feature request. The benefit they receive is easy to understand too. Actually, writing our requirements this way won’t be very hard.
Rick: Great! Let’s just get them in the backlog and get started on our first sprint.
Alex: Not so fast, Rick. We still need to figure out how to estimate this stuff. And we don’t even know what “this stuff” really is! Seriously... what, exactly, are we going to build?
User stories help teams understand what users need
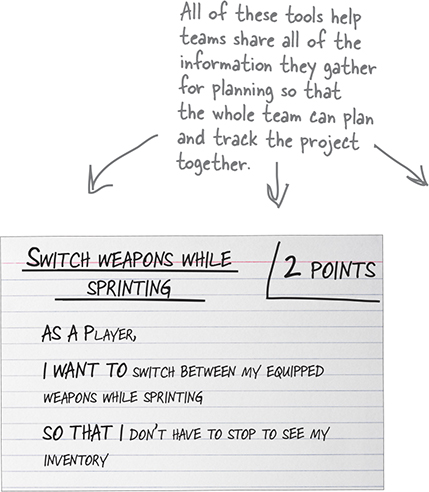
Software helps people do things. When a user asks a team to build a feature, it’s because they need to be able to do something in the future with it that they can’t do today. The most efficient way to make sure the team builds the right thing is to keep those needs in mind throughout the development process. A user story is a very short description of a specific thing that users need. A lot of teams write them on index cards or sticky notes. By organizing all of their work around user stories, Scrum teams make sure they keep user needs front and center in their planning and prioritization process. That way, they stay focused on building what their users need and there are no surprises when the team demonstrates the stories at the end of the sprint.
User Stories
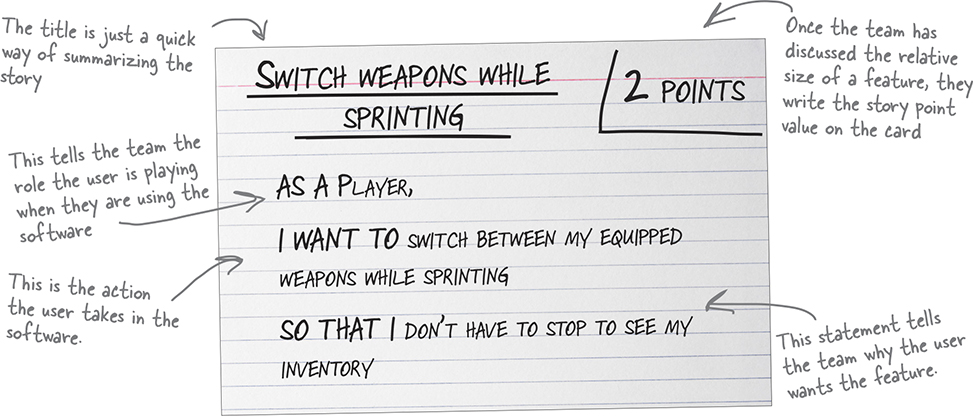
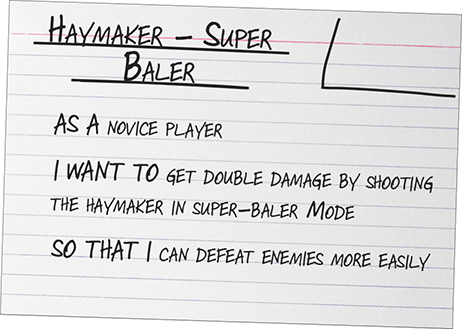
User stories describe how the user will use the software in just a few sentences. Many teams write user stories on note cards following a fill-in-the-blank format:
As a <type of user>, I want to <specific action I’m taking> so that <what I want to happen as a result>.
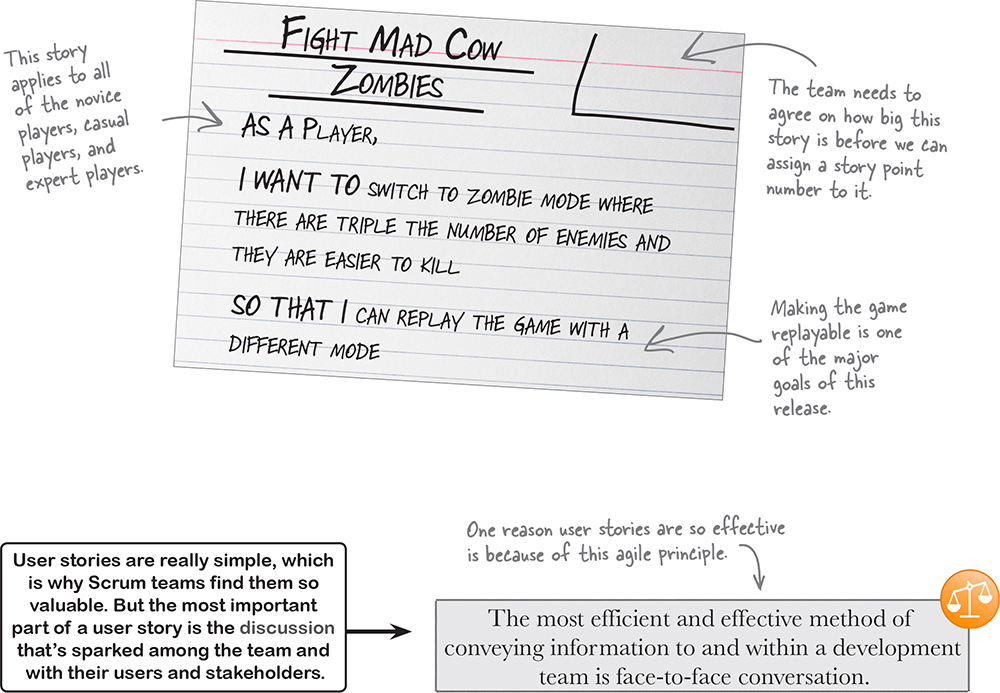
Because stories are short and modular, they’re a good reminder for the team to constantly confirm that they’re building the right features. You can think of each story card as a symbol for a conversation that the team is having with users to make sure that they’re building features that are useful to them.
Story points let the team focus on the relative size of each story
The goal of planning isn’t to predict the order features will be done in or their exact completion dates. Instead, the team assigns a point value to each story based on how big it is. That’s why most Scrum teams plan their projects using story points, which let them compare stories with each other. By focusing on the relative size of features rather than the exact amount of time it will take to develop them, Scrum teams keep the team engaged in planning together and allow for uncertainty in their plans.
How story points work
Story points are simple: the team just picks a number of points that represents the amount of work required for each story, and assigns that number to every story in the sprint backlog. Instead of trying to predict exactly how long it will take to build a feature, the team assigns a point value to each story based on its size relative to other features they’ve built before. At first, the estimates vary a lot from story to story. But after a while, the team gets used to the scale they’re using to estimate and it gets easier to figure out how big each story is.
One way that teams start using story points is to divide stories up into T-shirt sizes, and assign a point value to each size. For example, they might decide to use 1 point for extra small features, 2 points for small features, 3 points for medium features, 4 for large, and 5 for extra large. Once they decide on a scale, they just need to decide which category each story fits into. Some teams use the Fibonacci sequence (1, 2, 3, 5, 8, 13, 21...) for story point scales because they think it provides a more realistic weight for bigger features. As long as your team uses a scale consistently, it doesn’t matter which one they use.
Whatever doesn’t get done in a sprint is moved from that sprint to the next and the total number of story points that are completed in each sprint is tracked as the project’s velocity. If a team finishes 15 stories totalling 55 story points in a sprint, they track the 55 points as the sprint velocity and that gives them a general idea of roughly how much they can do in the next sprint.
Over time the team gets better and better at assigning story points and more and more consistent in the number of points they deliver in each sprint. That way the team gets a feel for how much they can do in a sprint and takes control of planning together.
| Extra Small | Small | Medium | Large | Extra Large | Extra Extra Large |
| 1 point | 2 points | 3 points | 5 points | 8 points | 13 points |
The whole team estimates together
Once the team has a prioritized list of user stories to get started with, they need to figure out how much effort it will take to build them. They usually estimate the story points needed to build each story out as part of the Scrum planning meeting at the start of each sprint. Most often the team knows which stories are the highest priority by looking at the backlog, so they try to commit to as many high priority stories as they can in each sprint. One way the team does this is planning poker.
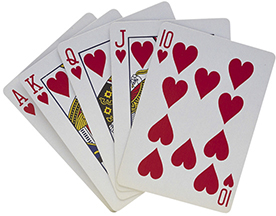
The setup
Each team member has a deck of cards with valid estimation numbers on each card. Usually the Scrum Master moderates the session.
When the team can’t be in the same room to use cards, the team will agree on the point scale they’re going to use up front and a method for communicating estimates. Many distributed teams will have everybody give their estimates over an instant message system to the moderator instead of using physical cards.
Understanding each story
The team goes through each story in the sprint backlog in priority order with the Product Owner and asks questions about the story to figure out what the users need.
Assigning a story point value
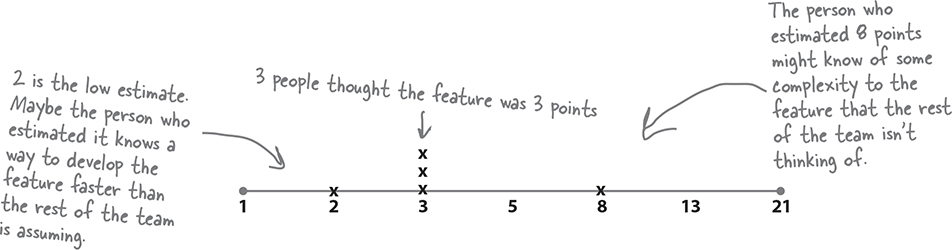
Once the team has discussed the feature, each person assigns a story point value by choosing a card from the deck and shares that value with the group.
Explaining the high and low numbers
If the estimates differ between team members, the high number and the low number explain their estimates.
Adjusting the estimates
Once the team has heard the explanations, they have a chance to choose an estimation card again. If the team can’t be in the same room, they communicate their estimate using e-mail or IM to the moderator without sharing it out loud to the team.
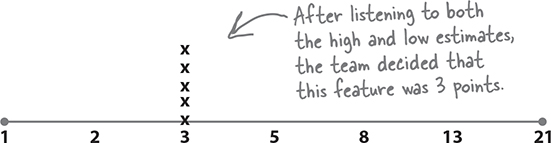
Converging on an estimate
Usually, teams start with a significant range of estimates but that range narrows over the course of explanation and adjustment. After a few iterations through the process, the estimates converge on a number that the team is comfortable with. It usually only takes 2-3 iterations of discussion until the team can unanimously agree on a story point value.
Planning poker is very effective, in part because it’s collaborative. When the team estimates effort for an item, each team member estimates the whole effort, not just his or her part of it. So even if you’re not doing the work, you’re estimating it... and that helps everyone on the team get a better understanding of the whole project.
No more detailed project plans
It feels like you’ve got a really good handle on your project if you create a plan to map out all of the dependencies and figure out who will be doing what from the time you start until the end. Traditional project plans make everybody feel like the there’s a guarantee of success because everything has been thought through. More often than not, the information you have at the beginning of the project isn’t enough to make a completely accurate detailed plan. But some of the decisions traditional project plans ask you to make in the beginning turn out to be different than the ones you’d make if you were in the middle of the project.
Scrum teams try to make decisions at the last responsible moment and allow for change, because they realize that detailed project plans can lead a team to focus on following the plan rather than responding to the changes that come up naturally. That’s why Scrum teams work on prioritizing the backlog and doing the highest priority work first. That way, they’re always working on the most important tasks, even when things change.
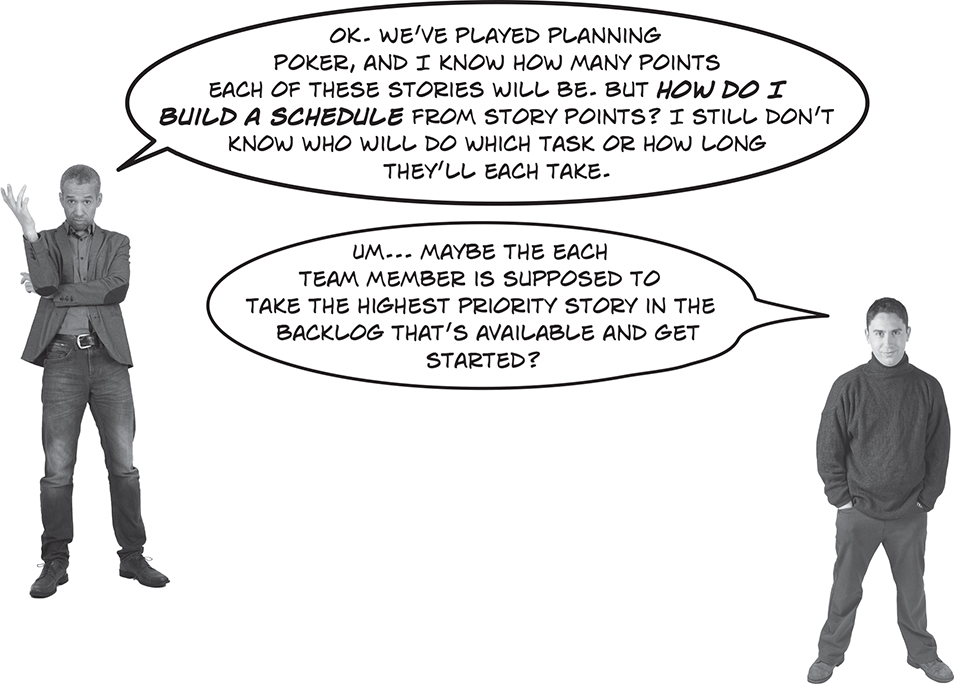
Rick: Wait, no! That’s definitely not right. How do I know when we’ll be done? Or who’s doing what?
Brian: You’re right. Assigning a story point value to a user story is a lot different than telling you how many days it will take to do the work.
Rick: So I’m just supposed to tell upper management that we’ll do as much work as we can over the next two-week sprint?
Brian: Well, as long as we’re all working on the highest priority features, we’re doing the most valuable work we can be doing. I think it’s a combination of us doing high priority work and demoing what we’ve done in every sprint review that keeps everyone in the loop.
Rick: OK. But without a project plan, how do I even know if everybody is busy working on the right tasks?
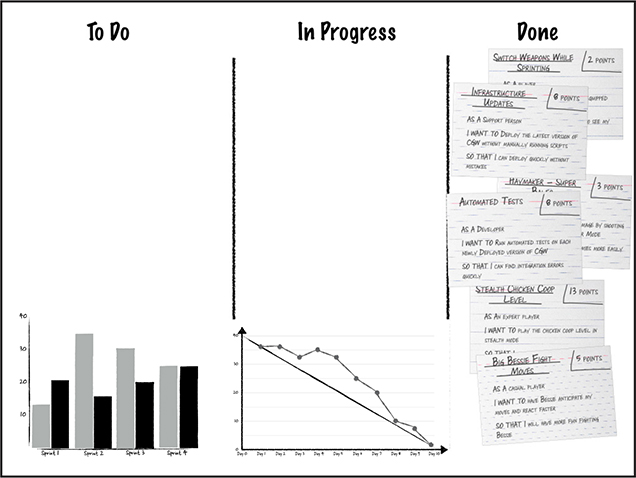
Taskboards keep the team informed
Once your team has planned the sprint, they need to get started building it. But Scrum teams generally don’t sit down and figure out who will do each task at the beginning of each sprint. They try to make it easy for team members to make decisions at the last responsible moment by giving the whole team constantly updated information about how the sprint is progressing.
Most teams start by marking a whiteboard with three columns: To Do, In Progress, and Done. As a team member starts working on a story, he or she will move it from the To Do column to the In Progress column and to the Done column when it’s complete.
Note
This task board has just the stories, and a lot of agile teams do this. But many teams add cards or stickies to their board for the tasks that the stories are decomposed into, grouped under each story card. When the first task moves into the In Progress column, the story goes with it. It stays there until the last task is Done.
Sprint Begins
All of the user stories are in the To Do column because no one has started working on them yet.
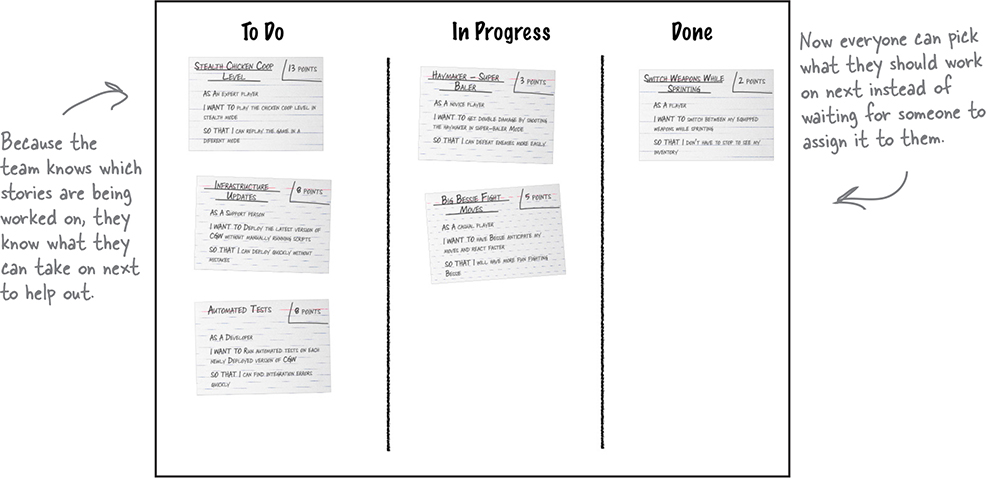
Mid Sprint
Team members move their tickets to In Progress when they start working on them and to the Done column as they are completed. The team usually agrees to a definition of done up front so that everyone is clear on what it means to be done with a story.
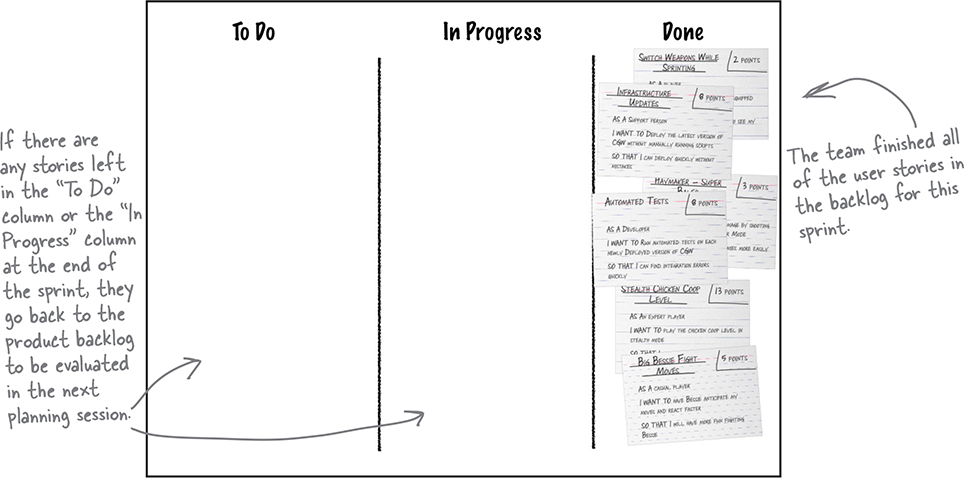
Sprint Ends
If the team estimated well, all of the user stories they put in the backlog have been moved to the Done column. If there are leftover user stories, they’re added to the next sprint backlog.
there are no Dumb Questions
Q: So what’s the difference between a user story and requirement? Is it just that it’s written on an index card?
A: No. In fact a lot of teams don’t write their user stories on cards at all. Often, they’re created as tickets in an issue tracking system. They can be rows in a spreadsheet, or bullets in a document. The biggest difference between user stories and traditional software requirements is that user stories don’t attempt to nail down the specific details about the feature that’s being described.
The goal when you’re writing a user story is to capture just enough information that everybody can remember who’s going to use the feature, what it is, and why users want it. The story itself is a way to make sure that the team talks about the feature and understands it well enough to do the work. Sometimes teams will need to write more documentation once they’ve confirmed the story with the users. Sometimes just having the conversation is enough, and the team can build the feature without any more documentation. However they do it, the most important thing is for them to understand what the user needs, and his or her perspective.
Q: How do I know how many story points to assign to a story?
A: When a team is starting to use story points for the first time, the first thing they typically do is get together and decide what type of work is worth one story point—usually a simple task that everyone on the team can understand. (For example, a team working on a web application might decide that one story point is equivalent to the effort it takes to add a button with some simple, specific functionality to a web page.) Depending on the kind of work they usually do, they’ll choose a scale that makes sense to the team. But once they decide the value of one point, it helps the team understand the rest of the possible point ranges.
Some teams use a practice called T-shirt sizing to assign all of the stories they’re estimating into small, medium, or large categories and assign points that way (1 point for small, 3 points for medium, 5 points for large). Other teams use broader scales (XS, S, M, L, and XL) with corresponding point values. Other teams assign values using the Fibonacci sequence (1, 2, 3, 5, 8, 13, 21...). As long as the team is consistent in how they assign points to stories, it doesn’t matter which approach they use.
Q: What’s the point of planning poker? Can’t developers just estimate their work on their own?
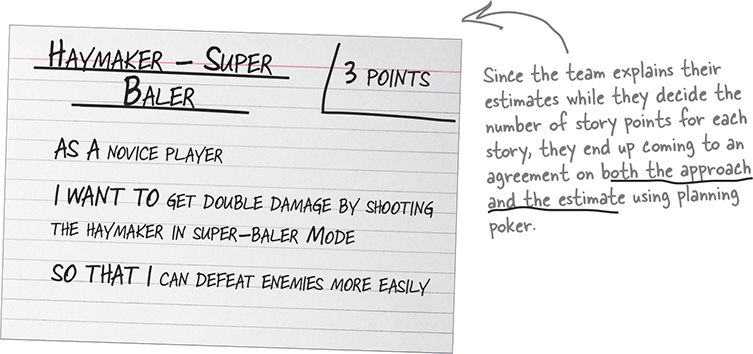
A: Like most of the other GASPs, planning poker focuses on involving the whole team in planning and tracking progress on your project. Planning poker is all about getting the team to discuss their estimates and agree on the right approach for development. By being transparent about estimates and approach, the team can help each other avoid mistakes and think through the most efficient method for developing each feature together. Planning poker helps teams make their estimation reasoning transparent. When the team decides on the approach and the estimate together, they have a much better chance of catching flaws in their approach earlier and they have a better handle on the work that needs to be done.
Q: What happens if you get the estimate wrong?
A: That happens—and it’s OK. You might end up thinking that a feature is worth 3 story points at the beginning of the sprint but realize by the end of it that it should’ve been a 5. But since story points are used to measure your overall velocity over time, you’ll find that the whole team gets better and better at figuring out which features are which as they work with their scale. What’s great about planning poker and story points is that they don’t expect you to be able to predict the future. Once you assign story points to your sprint backlog, you build your sprint backlog and then track your velocity numbers over time. If you have more story points in the backlog than you can do in the sprint, they go back to the product backlog so they can be reprioritized. As the team estimates and keeps track of what they’re delivering, they get better and better at it.
In the beginning, you’ll see that the number of story points your team completes per sprint varies a lot. But as the team gets more and more comfortable working together, the number of story points they can accomplish in a sprint becomes more and more predictable.
Rather than focusing on getting each estimate right, GASPs help your team to get a handle on how much work you can actually do. That way you can take on the right amount in each sprint and keep your team working as efficiently as possible.
Planning poker, story points, and velocity get the whole team planning and tracking work together. All of these tools are about the whole team staying accountable for the project’s vision and plan.
That’s true. Stakeholders who are used to traditional status reports and project plans will need to adjust to these practices.
Traditional project management methods create a plan for delivery up front and then track delivery to that plan. Getting everybody in your organization to give up that feeling that they know exactly how a project will be developed from the very beginning can be a major challenge for agile teams.
Instead of planning each detail up front and holding the team to that plan, Scrum teams promise transparency, the ability to change, and a team focus on building the best product possible with the time and resources available. By building incrementally and delivering frequently, they often have much happier stakeholders once they get accustomed to working differently.
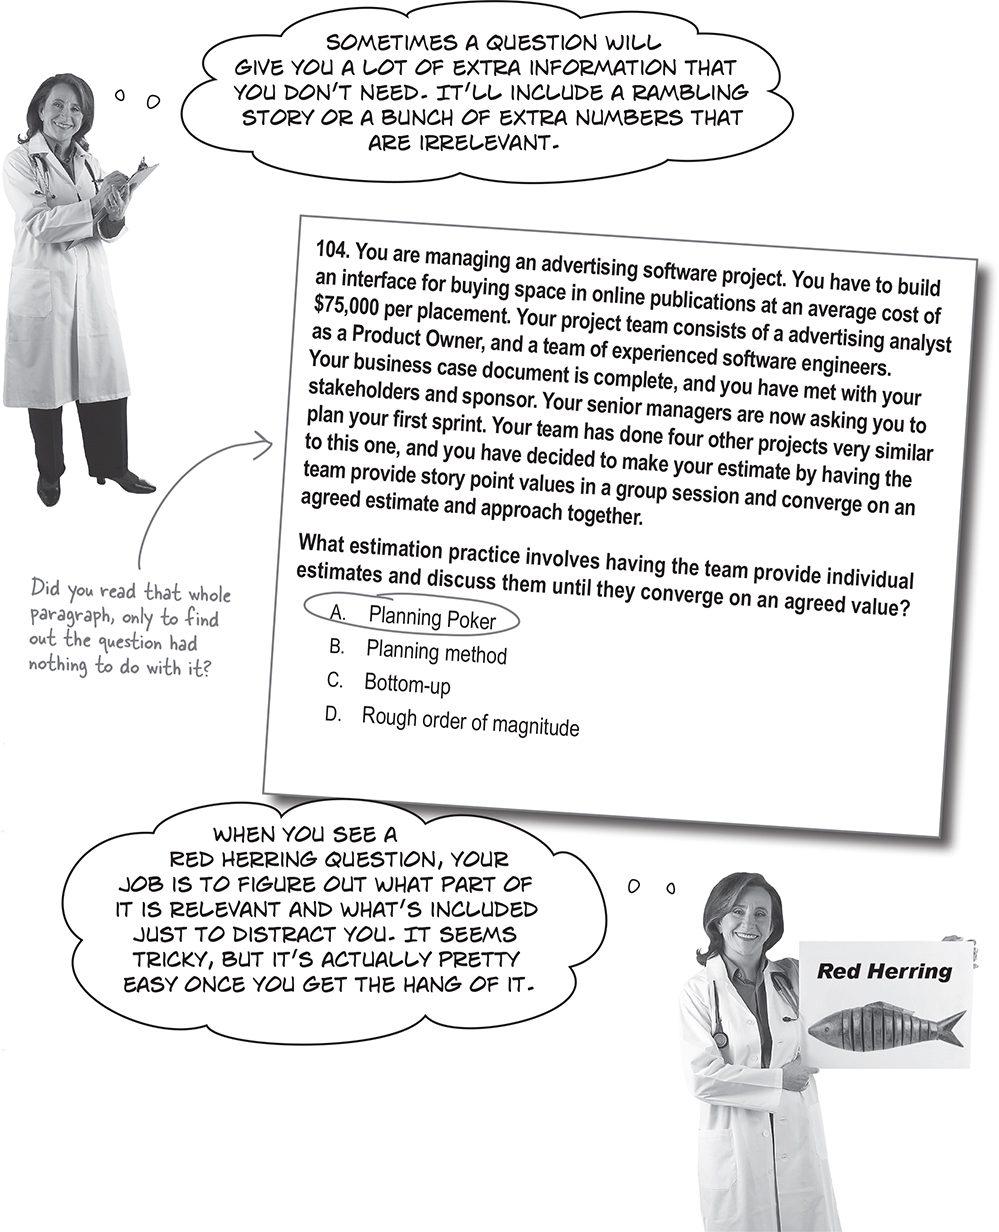
Question Clinic: The red herring
Rick: It feels like we’ve almost got it down. Alex keeps the product backlog prioritized. At the start of each sprint we go through the highest priority stories, play planning poker, and assign them story point values. Then we add them into the sprint backlog and get started.
Brian: That all works really well. The team likes getting a chance to talk through the work before we do it. It helps everybody stay on the same page about what needs to get done in a sprint, too.
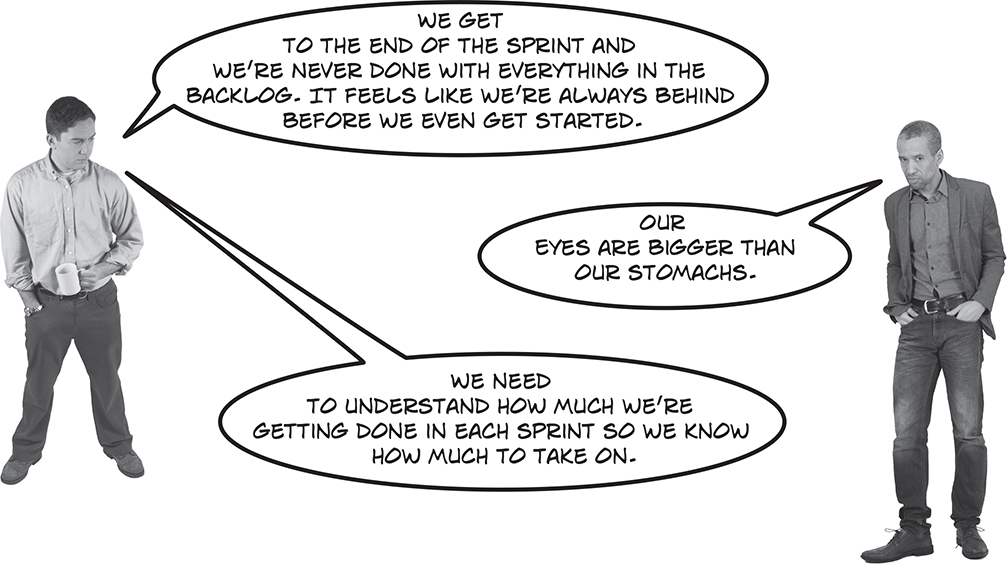
Rick: It does seem like it’s working, but then we get to the end of each sprint and we’ve always got stories that were bigger than we thought they were. There’s always stuff in the sprint backlog that needs to get carried over the next sprint. That’s making Alex nervous and making our sprint reviews with the users more tense.
Brian: We need to know whether or not we’re on track during the sprint, so we can make adjustments if we need to. We shouldn’t commit to stories at the beginning of the sprint if we don’t think we can get them done.
Rick: I think it’s time for us to start tracking our progress more closely. So... um, how exactly do we do that with Scrum?
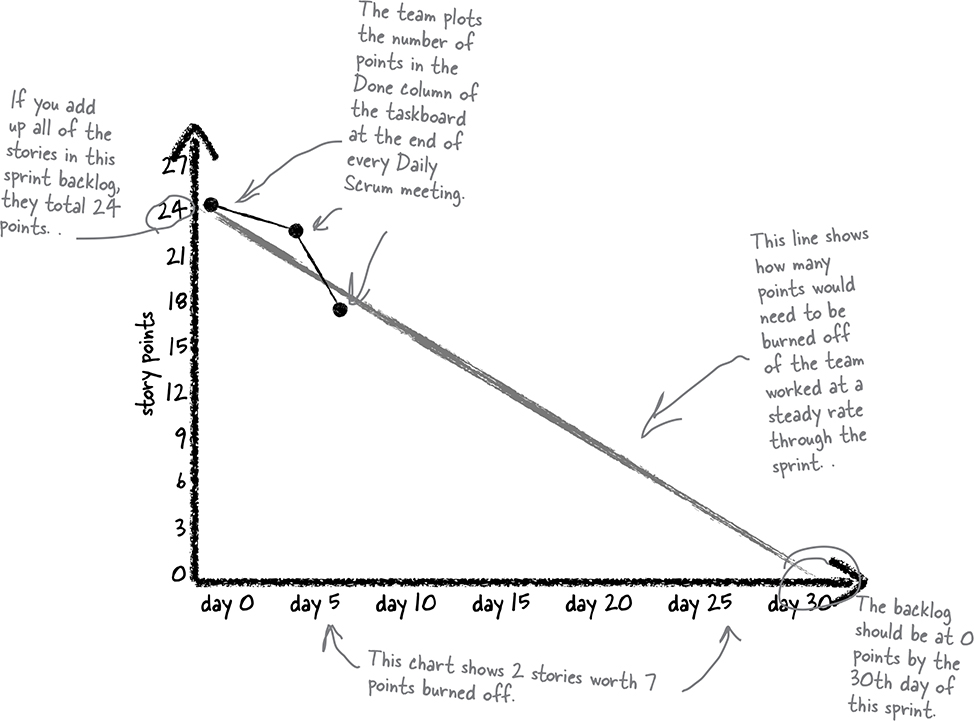
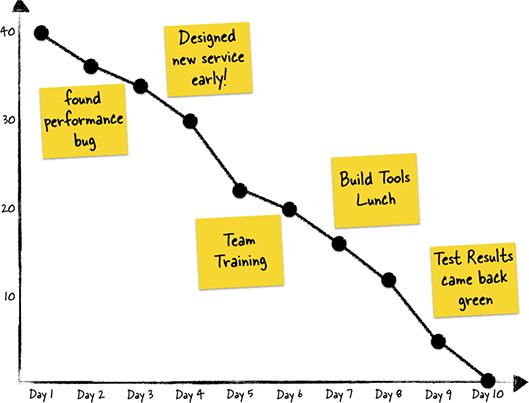
Burndown charts help the team see how much work is left
Once a team has assigned a story point value to all of the user stories in the sprint backlog, they can use burndown charts to get a handle on how the project is progressing. A burndown chart is a simple line chart that shows how many story points are completed each day during the sprint. The burndown chart gives everybody a clear sense of how much work is left to be done at any time. Using a burndown chart, it’s clear to everyone on the team how close they are to achieving their sprint goals.
Burndown charts and velocity help the whole team stay in control of the sprint.
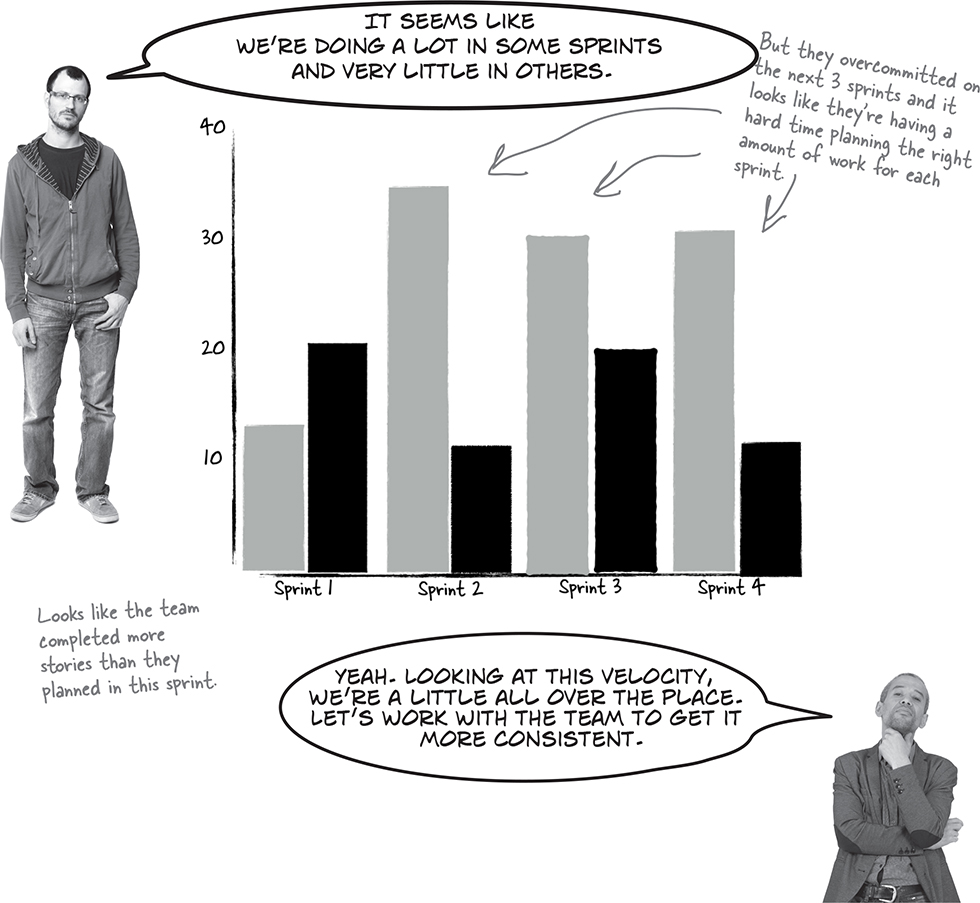
Velocity tells you how much your team can do in a sprint
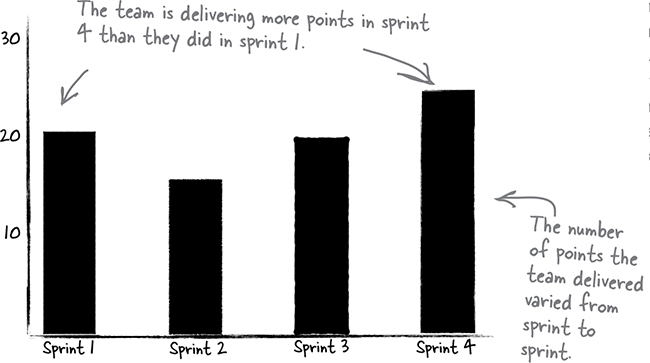
At the end of each sprint, you can count the total number of story points that have been accepted by the Product Owner. The number of points per sprint is called the velocity, and it’s a great way to gauge how consistently the team is delivering work. Many teams plot their velocity per sprint as a bar chart so they can see how they did across multiple sprints. Since each team’s scale for estimating story points is different, you can’t use velocity to compare teams to one another. But you can use it to help figure out how much work your team should commit to based on their past performance.
Sprint velocity
This is a bar chart of the total number of story points completed in each of four sprints. If the team is using the same scale for estimation in each sprint, you can use this number to compare how much work has been done from one sprint to the next. To create this chart, the team just adds up the number of story points in the Done column of the task board at the end of each sprint.
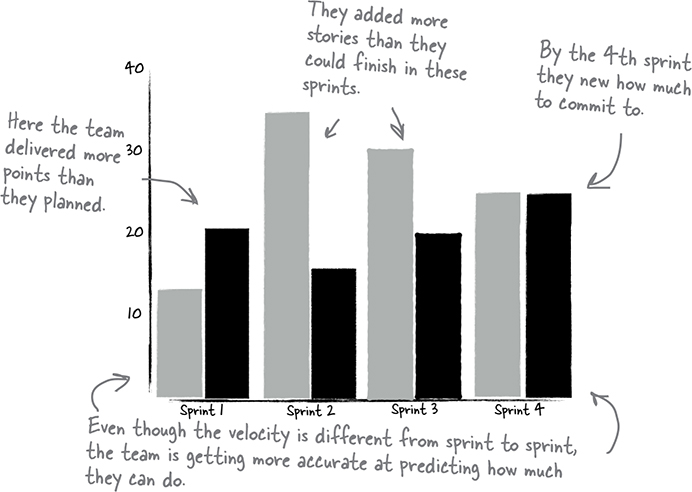
Sprint velocity with committed points
This is a bar chart of the total number of story points the team put into the sprint backlog in gray and the number they actually completed in black. To create this chart, the team just adds up the number of story points in the sprint backlog after the planning session and marks that as the committed number. At the end of the sprint they track the velocity number by adding up all of the story points in the Done column of the taskboard.
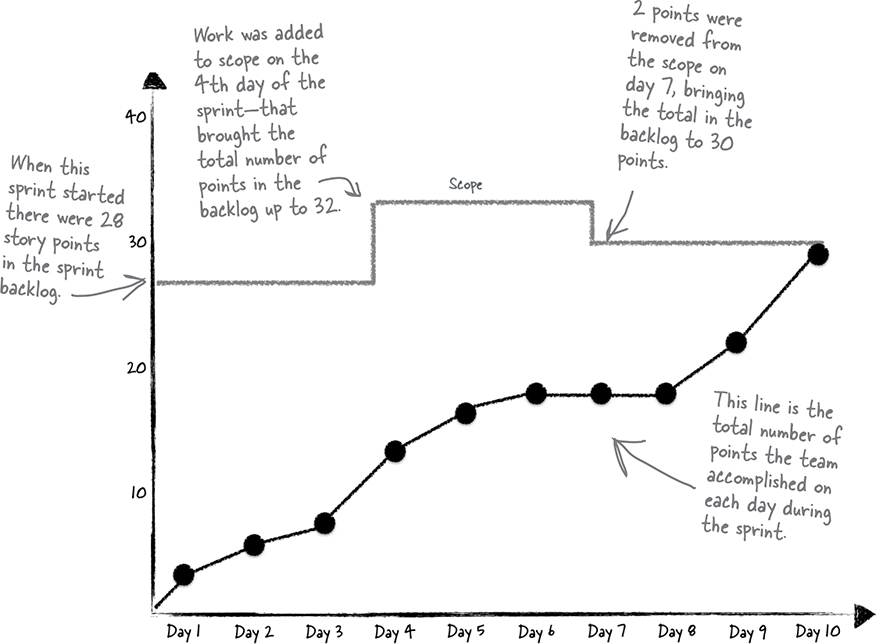
Burn-ups keep your progress and your scope separate from each other
Another way to track your progress during a sprint is to use a burn-up chart. Instead of subtracting the number you’ve completed from the number you committed to, burn-ups track a cumulative total throughout the sprint and show the total committed scope on a separate line. When stories are added or deleted from the scope it’s obvious by looking at the scope line. When stories are put into the “Done” column on the task board, that’s easy to see too, by looking at the total number of points burned up in the sprint. Because the scope is tracked on a different line from the number of points accomplished, it’s clearer when the scope is changing.
How do we know what to build?
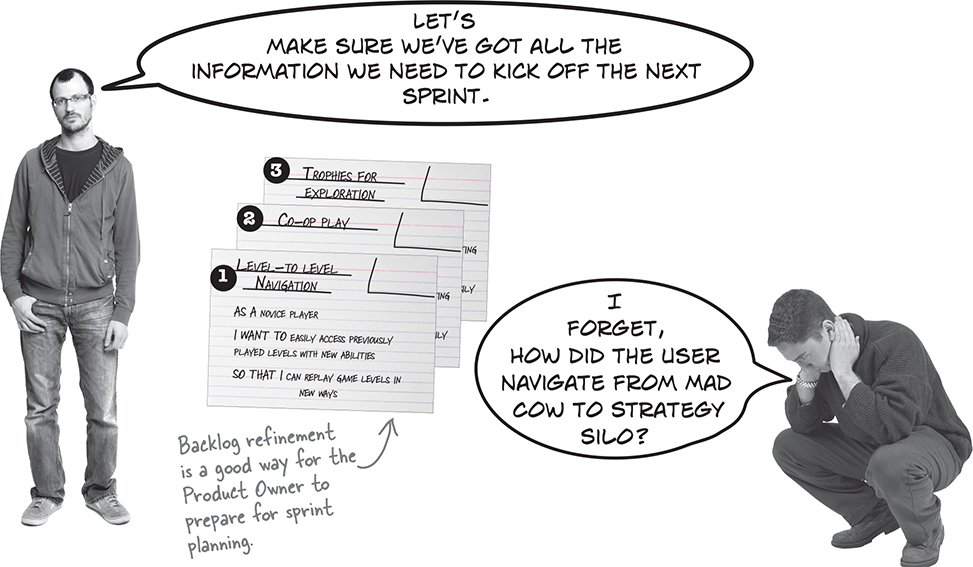
The Product Owner’s role on a sprint team is to keep everybody working on the most important thing in every sprint. They’re in charge of the order of stories in the sprint backlog and the product backlog. When the team has questions about a user story, the Product Owner is the one who tracks down the answers. Many teams set a time near the end of each sprint to make sure that the backlog is in order before the team starts to plan the next sprint. That meeting is called the product backlog refinement meeting.
Product backlog refinement is all about adding detail and estimates to each backlog item, and revising the order. Teams usually rely on the estimation that they do during Sprint Planning, but should feel comfortable re-estimating Product Backlog items any time. This is a collaborative effort between the Product Owner and the Development Team—and it’s focused entirely on the Product Backlog (the Development Team is solely responsible for the ordering of the Sprint Backlog).
Note
A lot of teams block out time 2 or 3 days before the end of the sprint to do backlog refinement. They use the time to come up with questions that need to be answered before the planning session, and to double-check the priority order of the stories.
Once the backlog refinement meeting is over, the Product Owner has a couple of days before the start of the next sprint to follow up on any open questions and make sure that the priorities make sense to business stakeholders as well.
Some teams refer to product backlog refinement as PBR. In general, teams typically spend less than 10% of their time doing this.
Story maps help you prioritize your backlog
One way to visualize the backlog is to lay it out in a story map. Story maps start by identifying the most core features of your product as its backbone. Then that functionality is broken up into the backbone’s most important user stories. Those are called the walking skeleton. Your first sprints should be focused on delivering as much of the walking skeleton as possible. After that, you can plan your releases to include features in their prioritized order on the map.
Note
Remember, these practices are not required by Scrum, but are generally accepted!
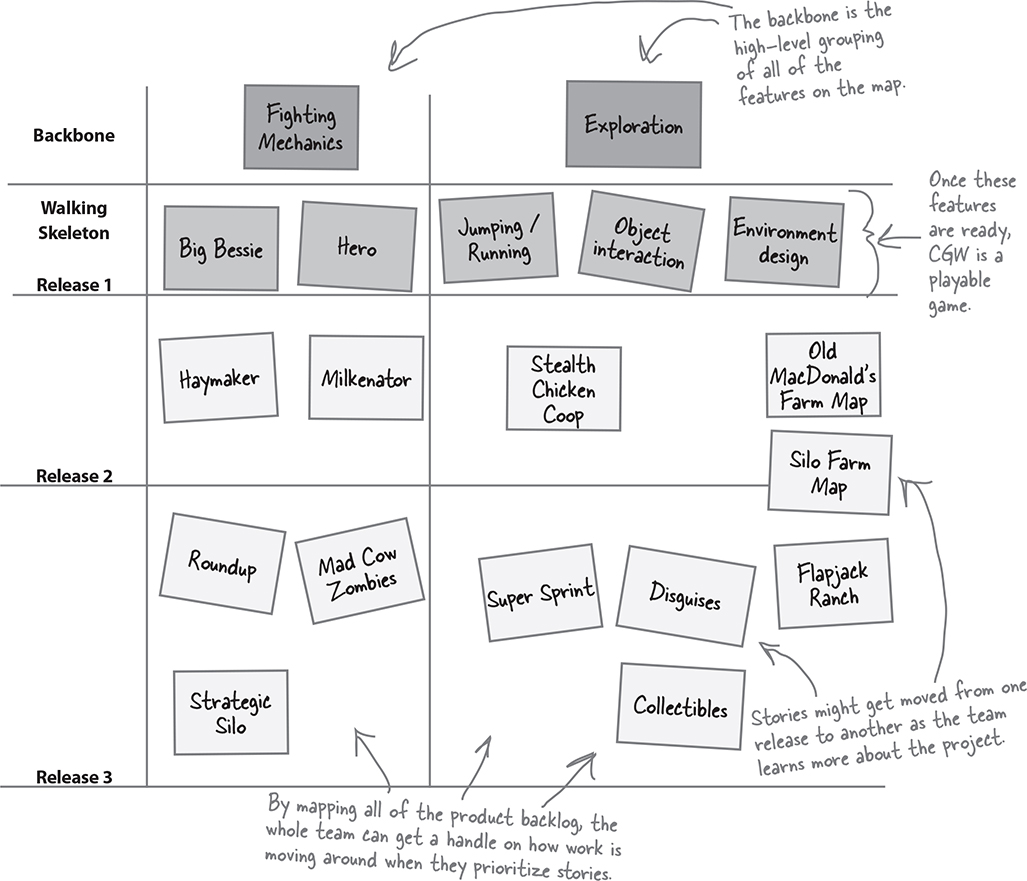
Story maps give teams a way to visualize the release plan
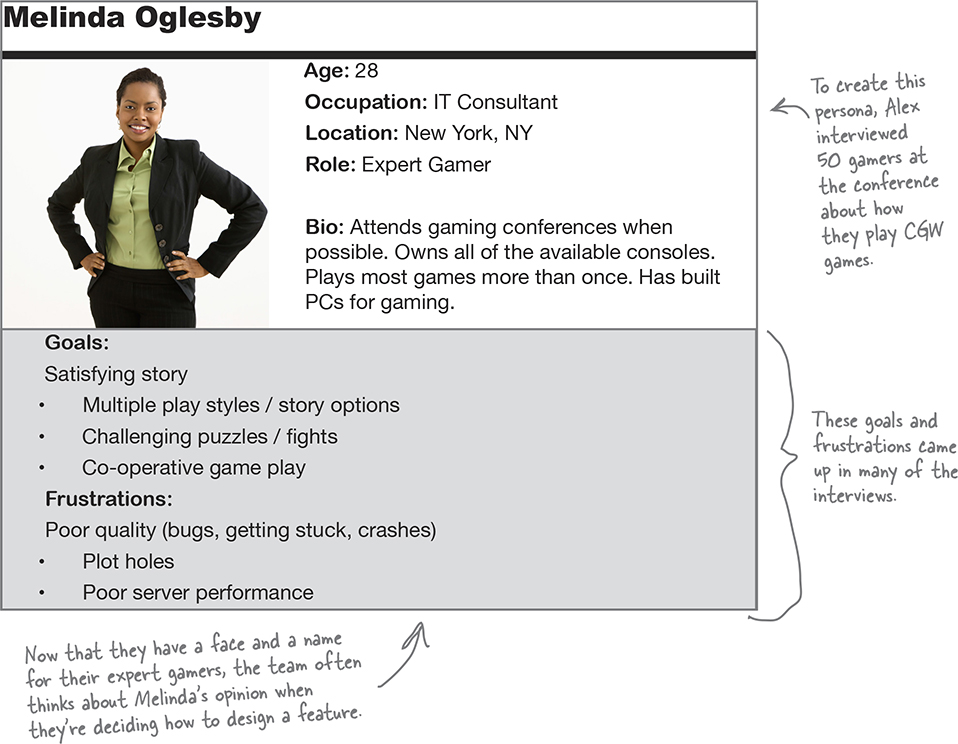
Personas help you get to know your users
A persona is a profile of a made-up user that includes personal facts and often a photo, which Scrum teams use to help them understand their users and stakeholders better. Putting a face to each user role and writing down what motivates them will help you make the right choices when you’re thinking about how and what to develop. Personas make your user stories more personal. Once the Ranch Hand Games team created them, they started thinking about how each user would react to the features they were building.
there are no Dumb Questions
Q: So how do I use points to make sure I’m on track for the whole project? Do I estimate the whole backlog?
A: Some teams do. Some teams estimate the entire backlog to come up with a release burndown chart where they track how far they’ve come in burning down all of the features initially put into the product backlog. This is how some teams predict their overall release dates for major projects.
But that only works if you’re relatively sure that everything that’s in the Product Backlog actually needs to be delivered as part of your project. In many cases, there are features in a product’s backlog that are so low priority that they will probably never be built. When that’s true, it doesn’t really make sense to estimate everything in the product backlog and use it to gauge a release date. Instead, many teams focus on building the highest priority functionality possible in every release and releasing software frequently. That way the most important features are always available as soon as possible.
Q: How do I know how many stories to put into a sprint?
A: When your team sits down to plan a sprint, they always use the Sprint Goal as the starting point to understand the priority of each feature in the Sprint Backlog. That should be enough for everyone to have a good idea of which features are most important. This is the idea behind commitment-driven planning (created by Mike Cohn, one of the most influential thinkers in Agile planning): that you deliver something tangible and valuable at the end of each sprint, and that you make trade-offs during the sprint to achieve that.
The other option teams have is velocity-driven planning. This means starting with the team’s average velocity, and adding the top stories from the backlog until they reach the average velocity. Cohn prefers commitment-driven planning because it relies on the team members’ judgement of what’s necessary to build a valuable product.
Q: Are story maps and task boards the same thing?
A: No. Both of them can use whiteboards and story cards to show what’s going on in your project, but they’re displaying very different information.
You can think of the taskboard as an up-to-date look at the sprint backlog. Checking it will always tell you what’s going on with each story in the current sprint.
The story map gives you a similar view of the current plan for all of the stories in the product backlog.
The story map helps everyone on your team have the same vision of where the product is going. Story maps give teams a way to visualize the release plan and understand how stories fit together.
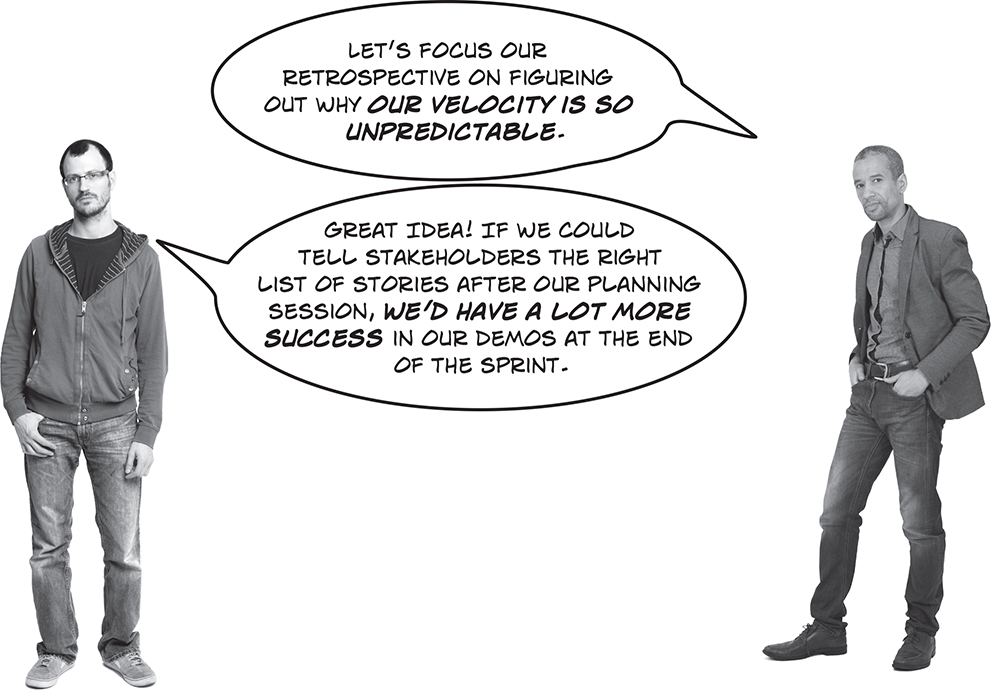
The news could be better...
Now that the team has simple metrics to track their performance, it’s easier for them to see when things don’t go as planned. When they take a look across a number of sprints, they can tell that they aren’t as predictable as they’d hoped they would be.
Retrospectives help your team improve the way they work
At the end of each sprint, the team reflects over the experience they just had and works together to fix any issues that came up. Retrospectives help your team stay aware of how things are going and stay focused on making things better with each sprint. As long as the team is learning from their experience, they’ll get better and better at working together as your project progresses. In Agile Retrospectives: Making Good Teams Great, Esther Derby and Diana Larsen lay out a simple outline for a retrospective meeting.
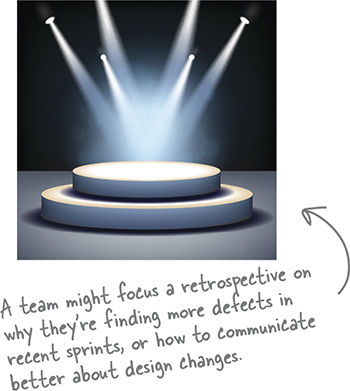
Set the stage
At the beginning of the meeting, everybody needs to understand the goal and focus of the retrospective. Derby and Larsen also recommend getting each team member to tell the team their overall mood as an opening activity. If everybody gets a chance to talk when the meeting starts, it’s more likely they’ll feel comfortable sharing their opinions later on.
Gather data
During this part of the meeting the team takes a look at all of the events of the last sprint using hard facts. They walk through the timeline and discuss the work that was completed and the decisions that were made. Often, team members are asked to vote on these events and decisions to determine whether they were high or low points for them in the sprint.

Generate insights
When the team has gathered the data about the sprint, they can zero in on the events that seemed to be the most problematic for the group. During this part of the meeting, the team identifies the root causes of the problems they encountered and spends time thinking about what they could do differently in the future.
Decide what to do
Now that they’ve reviewed what happened during the sprint and spent time thinking about what they might do differently, the next step is deciding which improvements to implement for the next sprint.

Some tools to help you get more out of your retrospectives
One way Scrum teams implement the Agile Manifesto principle of periodically reflecting and improving they way they work is to use these tools in their retrospective meetings:
Tools to help you set the stage:
Check-ins are a way to get your team to engage at the beginning of the retrospective. The retrospective leader will often ask team members to go around the room with each person giving a one- or two-word answer to a question at the start of the meeting.
ESVP is a technique where each member of the team is asked to categorize themselves into one of four designations: Explorer, Shopper, Vacationer, or Prisoner. Explorers want to learn and get as much as they can out of the retrospective. Shoppers are looking for one or two improvements out of the retrospectives. Vacationers are just happy to be doing something different and away from their desks for the meeting. Prisoners would rather be doing something else and feel forced to be part of the retrospective. Asking team members to say which group they think they are a part of helps everybody understand where they’re coming from and also helps them to feel more engaged in the meeting.
Tools to help you gather data:
Timeline is a way of displaying all of the meaningful activities that happened in a sprint in chronological order. Each member of the team gets an opportunity to add cards to the timeline with the events that were significant to him or her. Once the team creates the first round of cards to go on the timeline, they review it together and add new cards if they can think of events that should be on timeline.
Color Code Dots are used to indicate how team members felt about all of the events on the timeline. The moderator might hand out green dots to indicate positive feelings toward an event on the timeline and yellow ones for negative feelings. Then everyone on the team would go through the timeline indicating whether the activities on the timeline were positive or negative to them.
Tools to help you generate insights:
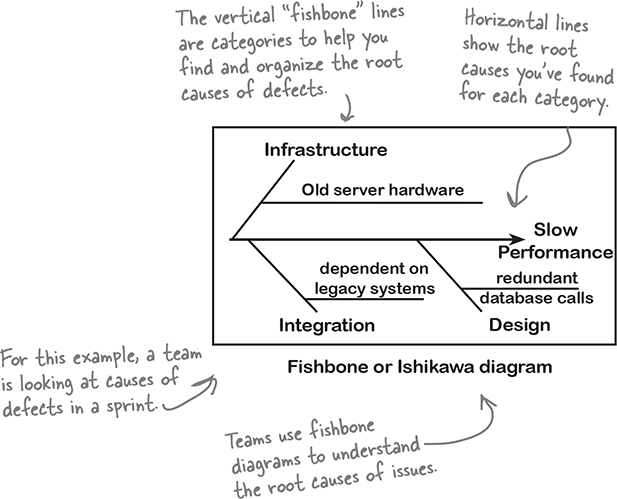
Fishbone diagrams are also called cause and effect and Ishikawa diagrams. They are used to figure out what caused a defect. You list all of the categories of the defects that you have identified and then write the possible causes of the defect you are analyzing from each category. Fishbone diagrams help you see all of the possible causes in one place so you can think of how you might prevent the defect in the future.
Prioritize with dots is a technique where each team member is given 10 dots to stick on the issues that they want the team to attempt to address first. Then choose the issues that have the most dots to focus on in the “decide what to do” phase of the retrospective.
Tools to help you decide what to do:
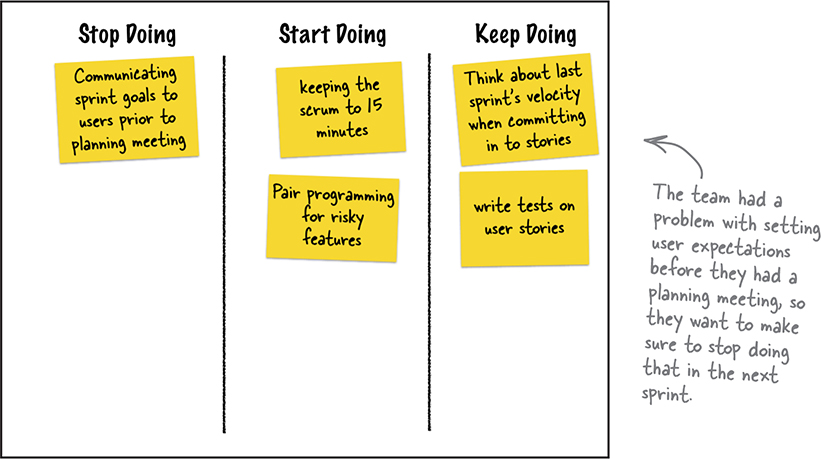
Short Subjects are a way a categorizing all of the insights the team has come up with into an action plan. Typically the moderator will put short subjects on the top of a whiteboard and the team will work together to put all of their suggestions in the right categories. One common set of short subjects is Stop Doing/Start Doing/Keep Doing. The team takes the time to categorize all of the feedback they’ve given in the retrospective into the kinds of actions that they can take to make sure they preserve the practices they’re doing that are working and change the ones that aren’t.
Cubicle Conversation
Scrum teams are always focused on improving. At the end of each sprint, everyone on the team takes a look at their burndown chart, their velocity, and the number of stories they’ve got on the backlog as input to their retrospective. Using the metrics the team has produced through the sprint helps everyone stay on the same page about the root causes of team issues, and that helps the team work together to solve problems that might’ve come up along the way. Retrospectives are just one more example of how Scrum teams use transparency, inspection, and adaptation to get better and better at building software.
Rick: Now that we’ve got velocity numbers for the past four sprints, it looks like we really need to get a better handle on how much we commit to at the beginning of the sprint.
Alex: But how do we do that? I’m only putting the stuff in the sprint backlog that the users need.
Rick: I think we should bring these velocity numbers to the team retrospective, show them the problem, and figure out some solutions together.
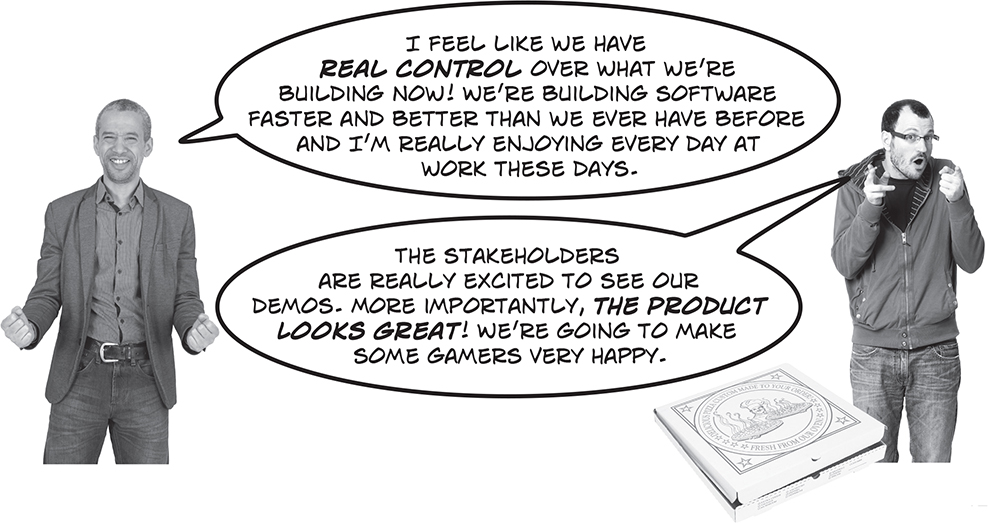
Pizza party!
The Ranch Hand Games team used their retrospectives to find and fix issues with planning and delivering CGW5. Over time, their sprints went more and more smoothly and they found themselves able to demo great new features in every sprint. By the time the team was ready to ship the game, the whole company knew they had a winner on their hands!
Exam Questions
Note
These practice exam questions will help you review the material in this chapter. You should still try answering them even if you’re not using this book to prepare for the PMI-ACP certification. It’s a great way to figure out what you do and don’t know, which helps get the material into your brain more quickly.
Burndown charts are used for all of the following except:
Helping the team understand how many points have been delivered in a given sprint
Helping the team understand how many points are left to be delivered before the end of a sprint
How many points each team member has delivered
Whether or not the team will deliver everything they committed to in a given sprint
The total number of story points delivered in a sprint is called the sprint ____________
Increment
Review
Ideal time
Velocity
Jim is a Scrum Master on a Scrum project in a media company. His team has been asked to buld a new advertising presentation component. They’ve been working together for 5 sprints and have seen increased velocity over the past two sprints. The team gets together on the first day of the sixth sprint for a planning session. In that session they use a method where the team discusses the features that will be built with the Product Owner, provide estimates on cards, and adjust their estimates as a group until they converge on a number they all agree to.
Which of the following BEST describes the practice they are using?
Planning poker
Convergence planning
Sprint planning
Analogous estimation
What acronym can be used to describe good user stories?
INSPECT
ADAPT
INVEST
CONFIRM
Velocity can be used for all of the following except:
To measure team productivity over multiple sprints
To compare teams to each other and find out who’s more productive
To understand how much a team can do when they’re estimating a sprint
To understand if the team is committing to too much or too little
Which tool is used to visualize scope changes?
Velocity Bar Charts
Burn-up Charts
Cumulative Flow Charts
Scope Histograms
How are user stories commonly written?
As a <persona> I want to <action>, so that <benefit>
As a <resource>, I want to <goal>, so that <rationale>
As a <role> I want to <action>, so that <benefit>
None of the above
Which of the following BEST describes a taskboard?
The Scrum Master uses it to see if the team is following the plan
It is used to identify new tasks during a sprint
It shows the total number of points accomplished in a sprint
It visualizes the work for the current sprint
Which of the following BEST describes Derby and Larsen’s retrospective method:
Set the stage, gather information, decide what to do, document decisions
Check in, create timelines, interpret the data, decide where to focus, measure
Set the stage, gather data, generate insights, decide what to do
ESVP, Color Code Dots, Short Subjects
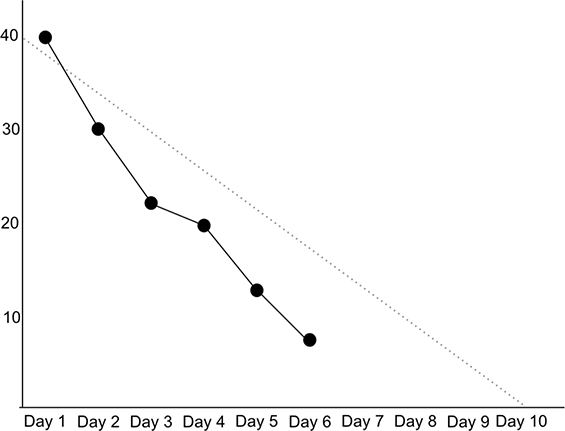
What can you tell about this sprint by looking at the burndown chart above?
The sprint is ahead of schedule
The sprint is behind schedule
The project is in trouble
The velocity is too low
What is the difference between a burndown and a burn-up chart?
Burndown charts subtract story points form the total number committed while burn-up charts start at 0 and add the story points to the total as they’re completed
Burndown charts have a line for scope that tells you how much is added or deleted as you go
Burn-up charts have a trend line to show you the constant rate of completion
Burn-up charts and burndown charts are the same
Which of the following is the BEST tool for determining the root cause of a problem?
Personas
Velocity
Fishbone diagrams
Short Subjects
A Scrum team for a medical software company took all of the user stories in their product backlog and arranged them on the wall according to how important the functionality is to a successful product. Then they used that information to determine which features to work on first. What term best describes the practice they were using?
Release planning
A walking skeleton
Velocity planning
Story mapping
The process of identifying requirements based on user stories is often referred to as
Card, Call, Confession
Story, Conversation, Product
Card, Conversation, Confirmation
Card, Test, Documentation
ESVP stands for
Executive, Student, Vice President
Explorer, Student, Vacationer, Prisoner
Explorer, Shopper, Vacationer, Practitioner
Explorer, Shopper, Vacationer, Prisoner
Your Scrum team began measuring velocity over the past three sprints and recorded the following numbers: 30, 42, 23. What can you tell about the team from these measurements?
The team is still determining its story point scale
The team is becoming less productive and actions must be taken to correct this
The velocity is evening out over multiple sprints
The velocity has not been measured correctly
Which of the following BEST describes a tool for identifying a representative software user and describing his or her needs and motivations?
Ishikawa diagrams
User Identification Matrices
Personas
Story Mapping
Scrum Planning tools help Scrum teams make project decisions...
As early as possible
Just in time
At the last responsible moment
Responsively
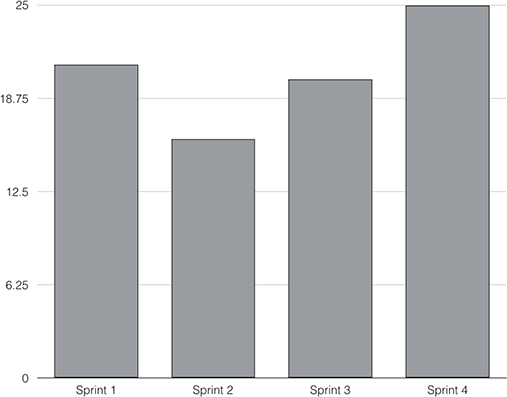
What can you learn about this project from looking at the velocity bar chart above?
The project has too much velocity
The team is delivering more story points as the project goes on
Too many scope changes are happening
The project is running behind
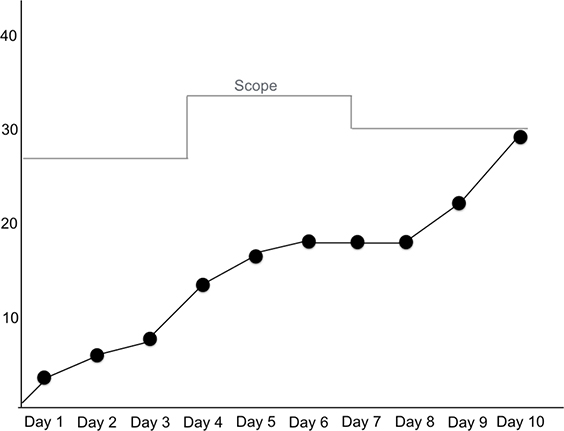
What can you learn about this project by reading the burn-up chart above?
Some story points were added to the project scope on day 4 and some were removed on day 7
The team is adding stories to the scope each day of the sprint
The team is not making progress
Stories were added to the project on day 4 and that caused a delay on day 8
Exam Answers
Note
Here are the answers to this chapter’s practice exam questions. How many did you get right? If you got one wrong, that’s OK—it’s worth taking the time to flip back and re-read the relevant part of the chapter so that you understand what’s going on.
Answer: C
Burndown charts help the whole team see how much they’ve accomplished and how much is left to do. They do not show individual team member productivity.
Note
Some people will argue that burndown charts are only about understanding work that’s left to do. All three of these things do appear graphically on the chart, so C is technically correct.
Answer: D
Teams measure the total number of points they deliver in each sprint as velocity. Velocity can be measured across multiple sprints to help teams get better at estimating and committing to work. Velocity is often used to show the effect of process changes as well.
Answer: A
The team is using planning poker. They are doing sprint planning, but since the question was specific about how they were planning, that’s not the best answer. They’re also doing analogous estimation, but that’s not the BEST answer for this question because it is not a generally accepted Scrum pratice. Convergence planning is a made-up name, so don’t be confused by counterfeit practice names like these.
Answer: C
The acronym INVEST stands for Independent, Negotiable, Valuable, Estimatable, Small, and Testable. A good user story should be all of these things.
Answer: B
Since velocity is the sum of all of the story points estimated in a given sprint, it can only be used within one team. Another team would have a different scale since their story point values would come from their sprint planning discussions, or from the estimation that they do during product backlog refinement.
Answer: B
Burn-up charts show scope as a separate line on the chart and make it easy to see when scope is added or removed.
Answer: C
The correct template for a user story is As a <role>, I want to <action> so that <benefit>. Although the other answers were close, there’s a big difference between resources, personas, and roles. Roles help you to identify the various perspectives that will need to be accounted for in the application.
Answer: D
Taskboards show everyone on the team the status of each task that’s in the sprint backlog. It’s a visual way to make sure that everyone has the same information about what’s available to work on, what’s in progress, and what the team has completed.
Answer: C
Retrospectives start by setting the stage and making sure that the whole team is included in the conversation. Then the team reviews the information they can gather from the sprint. Once everybody agrees on the facts, they use that inforamation to generate insights on what might be causing problems for the team, Once they’ve identified the problem, they can figure out what they want to do to try to fix the issue.
Answer: A
The dotted line shows a constant burn rate for the sprint. It’s normal for the number of points to fluctuate and be to the left of the line at some points and to the right of it at others. In this case, the actual completion line is far to the left of the dotted line and that indicates that the team is burning story points faster than the constant rate necessary for on-time completion.
Note
Some agile practitioners really dislike using the term “on schedule” to describe a burndown chart. However, this terminology may appear on the PMI-ACP exam, and a lot of managers talk in these terms. So it’s good to get used to seeing it!
Answer: A
Burndown and burn-up charts track the same information, the rate at which the team is completing story points. Burndowns track that rate by subtracting completed points from the total each day. Burn-ups track it by adding the number of points to the total each day.
Answer: C
Ishikawa diagrams are tools that are used to categorize common root causes for defects and issues in projects and help you to determine which issues fit into which categories. They’re often used to help you find out where you might improve the way you work so that you can fix process problems.
Answer: D
The team was mapping their stories so that they could determine the best sequence for delivering them.
Answer: C
Card, Conversation, Confirmation is a good way to remember that user stories cards are just reminders to talk to the people who have the information you need for building a story. This is one way Scrum teams value face-to-face communication over comprehensive documentation. They try to write down only what they need out of the conversations they have about each user story card.
Answer: D
ESVP is used as a means of checking in with each team member at the start of a retrospective. By asking each team member to tell if they are approaching the retrospective as an explorer, shopper, vacationer, or prisoner, the team can engage each team member in the conversation and let everybody know each person’s mindset from the beginning of the discussion.
Answer: A
It’s very common for teams to have a lot of variance when they’re first figuring out the scale they’ll use for estimation. It’s important not to be alarmed when velocity numbers vary. The goal of measuring velocity is to make the team aware of how much they are doing with each sprint so they get better at figuring out how much to take on in future planning sessions.
Answer: C
Personas are fake users that the team creates to help them understand how a user might be feeling when they use the software they’re building. (Some teams use actual people and not fake ones, but this is generally frowned upon for privacy reasons.)
Answer: C
Scrum teams know that making too many decisions up front, when you don’t know as much about the situations that will come up in a project, can cause more problems than it solves. That’s why they focus on making decisions at the last responsible moment.
Answer: B
This team is delivering more points with each successive sprint. That’s a great trend to observe over a project. It can mean that the team is continuously improving as they work.
Answer: A
Since burn-up charts show the scope line separately from the burn-up line, it’s easy to see when stories are re-estimated, added, or taken away from scope (as opposed to being completed as part of daily work).
Get Head First Agile now with the O’Reilly learning platform.
O’Reilly members experience books, live events, courses curated by job role, and more from O’Reilly and nearly 200 top publishers.

