The second step in this process is to add a widget to the dashboard. A widget is a component that encapsulates the metrics pertaining to a particular service.
In this exercise, we will create a number widget that provides a cross-sectional and instantaneous view of all of the metrics. For a more historical and perennial visualization, it is recommended to use line or stacked area widgets. The following screenshot shows the details of this process:
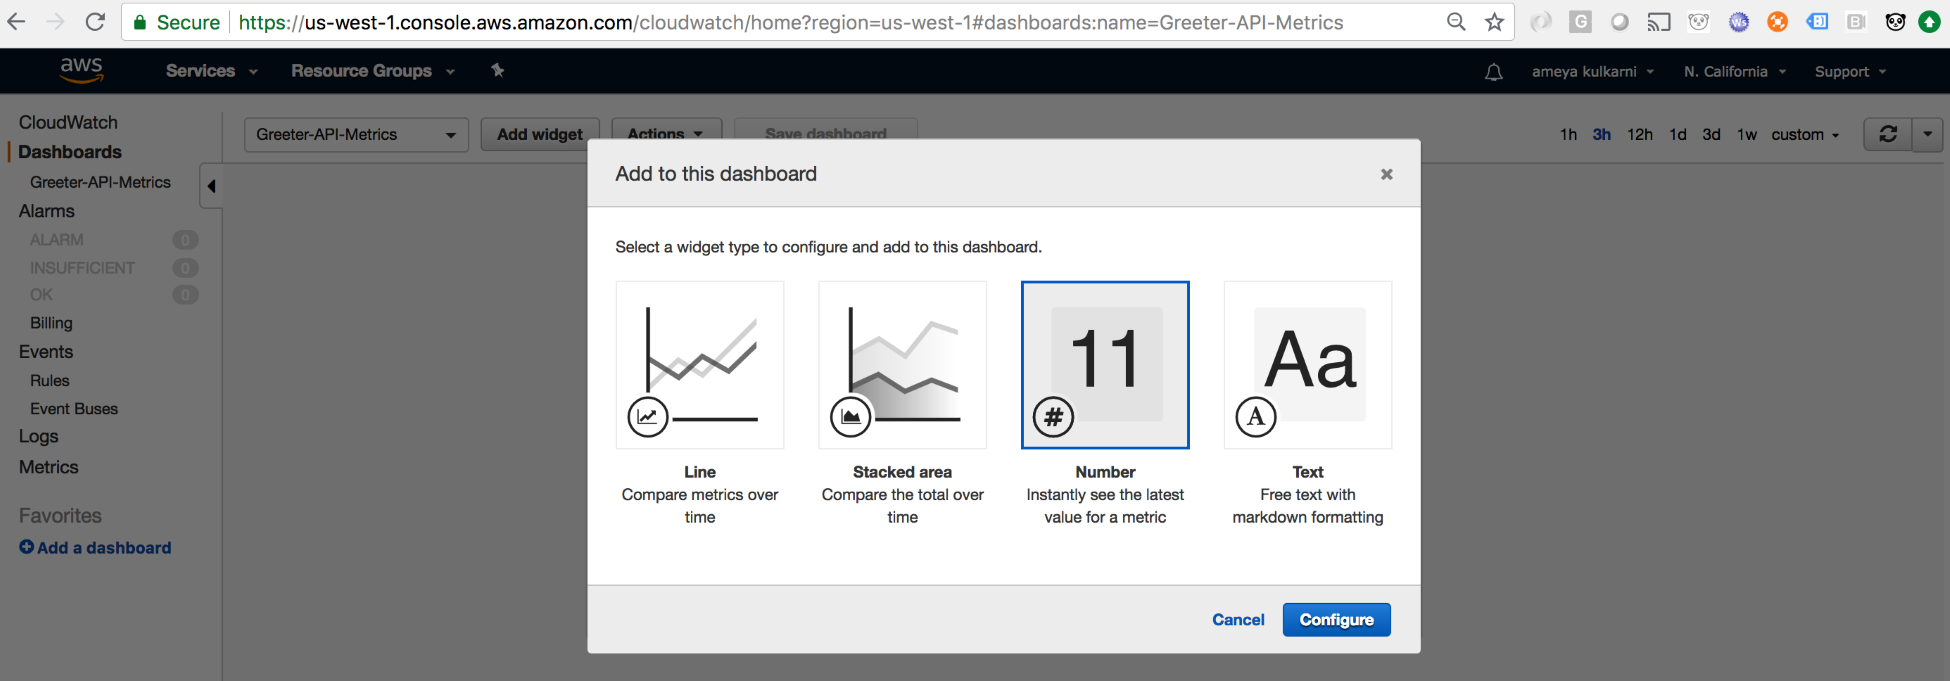
Configuring a number widget to be added to the dashboard

