Let's proceed to learn how to create an organization chart using Graphics View. An organization chart is a diagram that shows the structure of an organization and the relationship hierarchy of its employee positions. It is easy to understand a company's structure by using graphical representation; therefore it's best to use Graphics View instead of, say, a table.
This time, we need to create our own classes for the graphics items so that we can make use of Qt's event system, as well as have more control of how it's grouped and displayed.
First, create a C/C++ class by going to File | New File or Project:
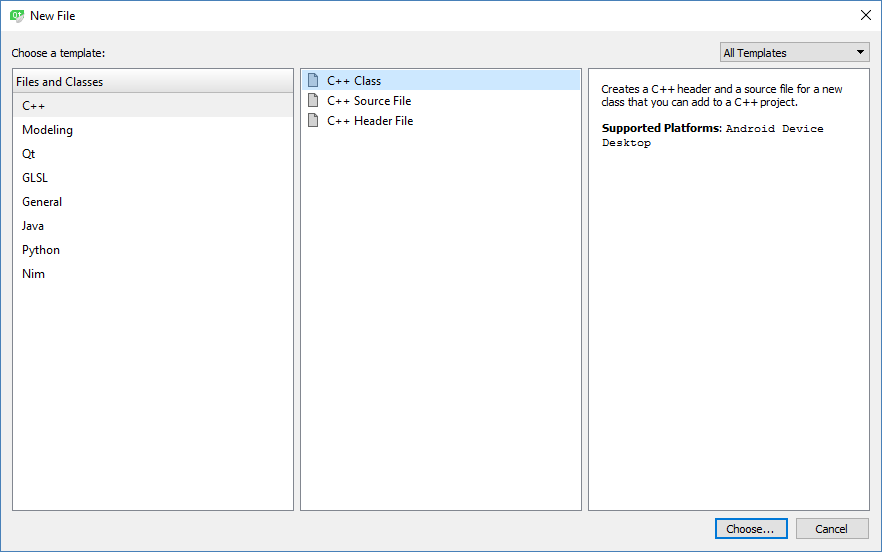
Next, ...

