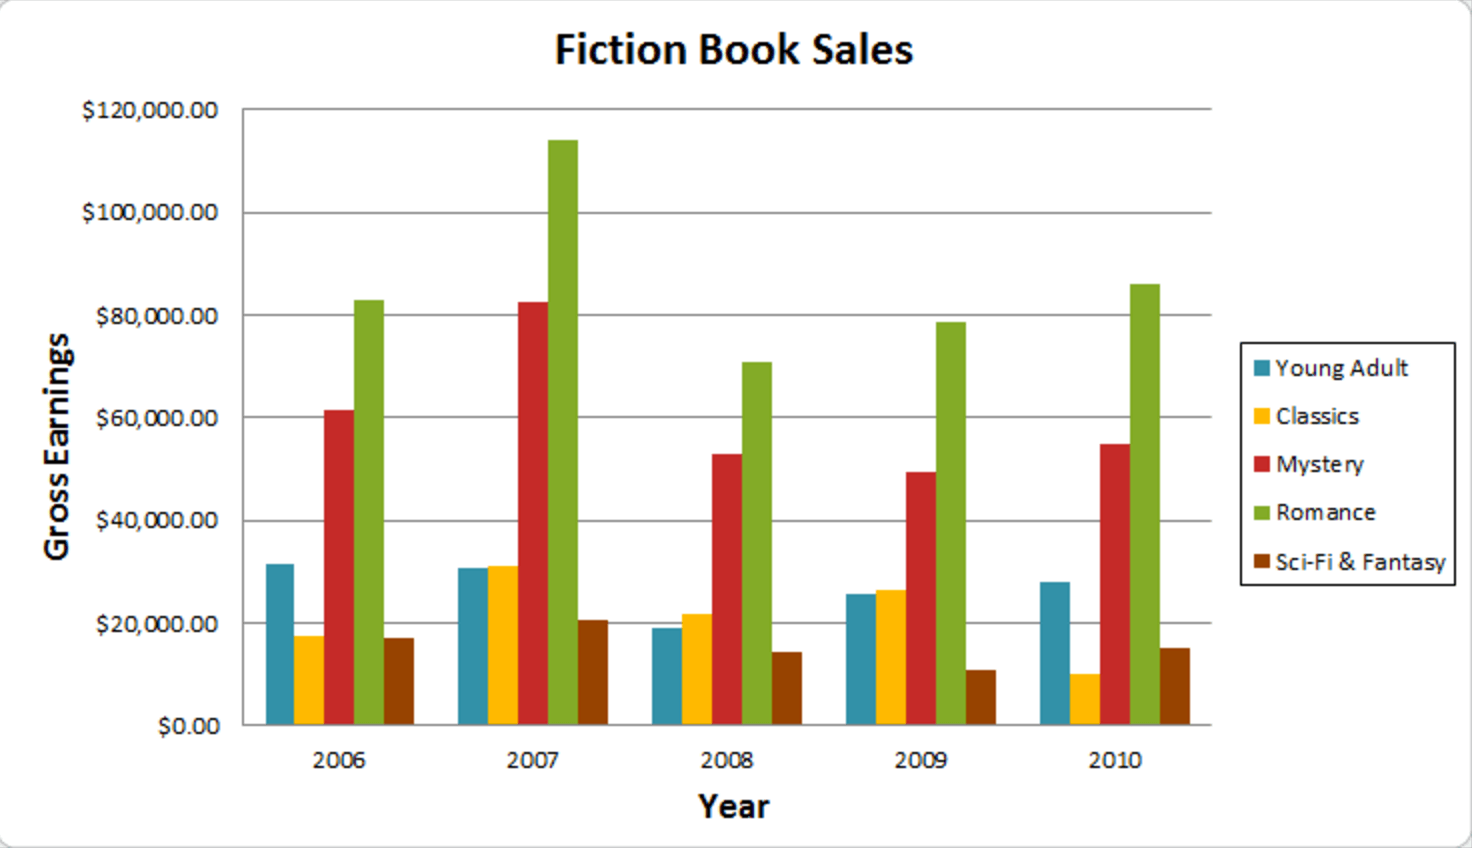
Bar charts are one of the most commonly used diagrams beside line charts and pie charts. A bar chart is quite similar to a line chart, except it doesn't connect the data along an axis. Instead, a bar chart displays its data using individual rectangular shapes, where its height is determined by the value of the data. This means that the higher the value, the taller the rectangular shape will become: