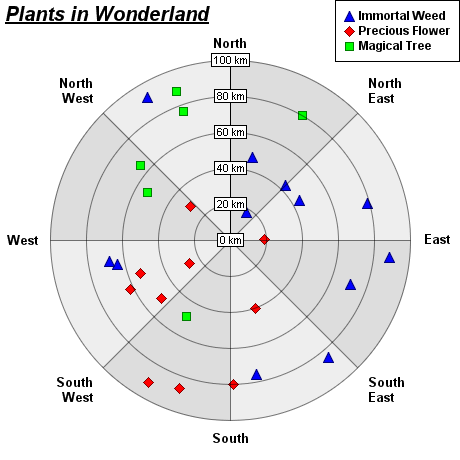
Polar charts present data in a circular graph, where the placement of the data is based on both the angle and the distance from the center of the graph, which means the higher the value of the data, the further away the point is from the center of the chart. You can display multiple types of graphs within the polar chart, such as line, spline, area, and scatter to visualize the data:
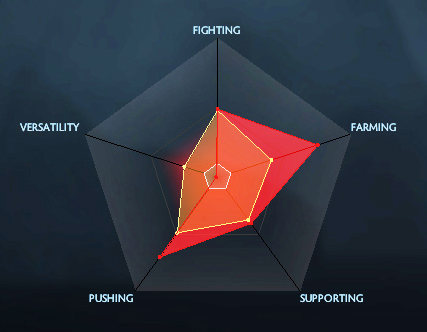
If you are a gamer, you should have noticed this type of graph being used in some video games to display the in-game character's attributes: