Line plots are usually applied using data along a traditional two-dimensional axes. It is perhaps the most common type of chart that we can see in everyday use. In R, plot with type="l" will create a line chart as shown here:
data("Hartnagel")
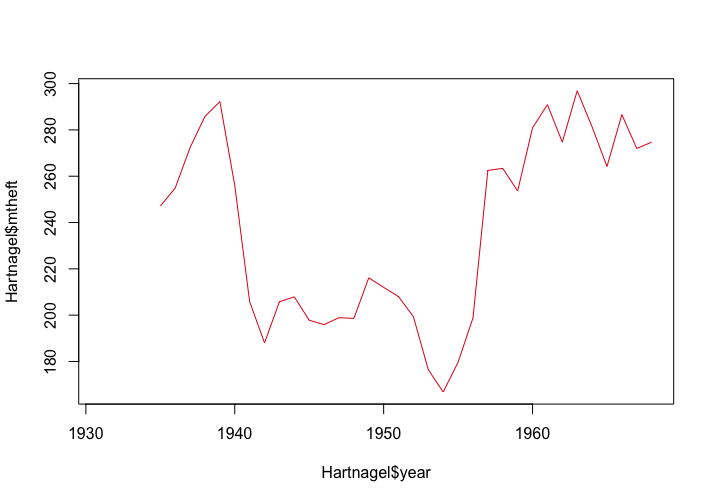
?Hartnagel # Canadian Crime-Rates Time Series
plot(Hartnagel$year, Hartnagel$mtheft, type="l", col=brewer.pal(8,"Set1"))
The output is as follows: