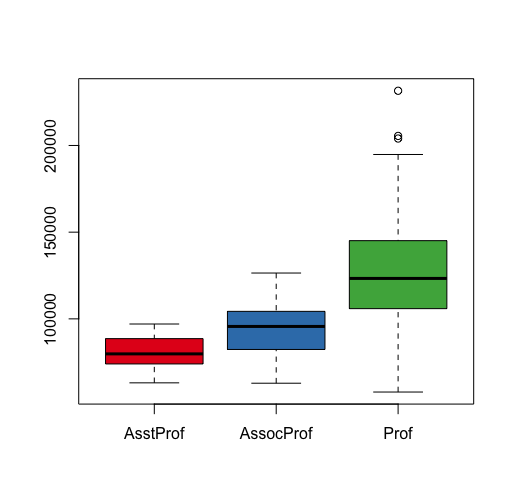
Boxplots can be used to get the minimum, median, maximum, and quartiles of the data being plotted. Boxplots also help to identify outliers:
b = boxplot(Salaries$salary~Salaries$rank, col=brewer.pal(8,"Set1"))

names(b)
# [1] "stats" "n"     "conf"  "out"   "group" "names"

b$stats
#         [,1]     [,2]     [,3]
# [1,] 63100.0  62884.0  57800.0
# [2,] 74000.0  82350.0 105890.0
# [3,] 79800.0  95626.5 123321.5
# [4,] 88597.5 104331.5 145098.0
# [5,] 97032.0 126431.0 194800.0
# attr(,"class")
# AsstProf
# "integer"
The output is as follows:
The pros and cons of using boxplots are as follow:
Pros:
Boxplots can be used to get an understanding of the distribution, ...

