The following code will be used to create a scatter plot:
plot(Hartnagel$year, Hartnagel$mtheft, col=brewer.pal(8,"Set1"))
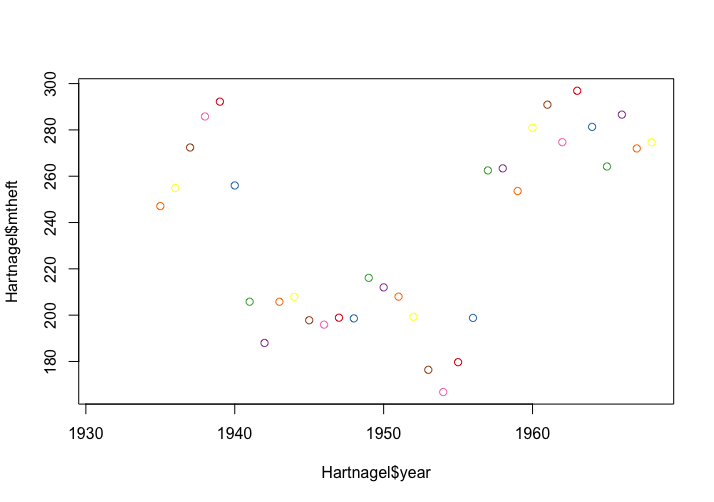
The output is as follows:
To view the various parameters supported in R graphics:
?par
The following code will be used to create a scatter plot:
plot(Hartnagel$year, Hartnagel$mtheft, col=brewer.pal(8,"Set1"))
The output is as follows:
To view the various parameters supported in R graphics:
?par
Get Hands-On Data Science with R now with the O’Reilly learning platform.
O’Reilly members experience books, live events, courses curated by job role, and more from O’Reilly and nearly 200 top publishers.
Get Mark Richards’s Software Architecture Patterns ebook to better understand how to design components—and how they should interact.

Dive in for free with a 10-day trial of the O’Reilly learning platform—then explore all the other resources our members count on to build skills and solve problems every day.
Start your free trial Become a member now