For the following Julia program, we use a package called Plots. The command used to install the package is Pkg.add("Plots"). Here, we run Julia programs via a Jupyter notebook. The Julia program is presented in the following screenshot:
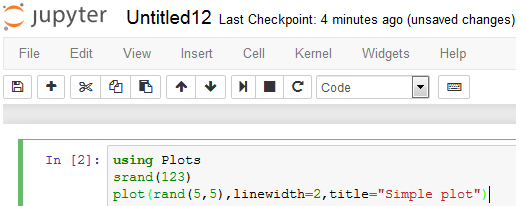
After clicking Kernel on the menu bar, and then Restart and Run All, we get the following:
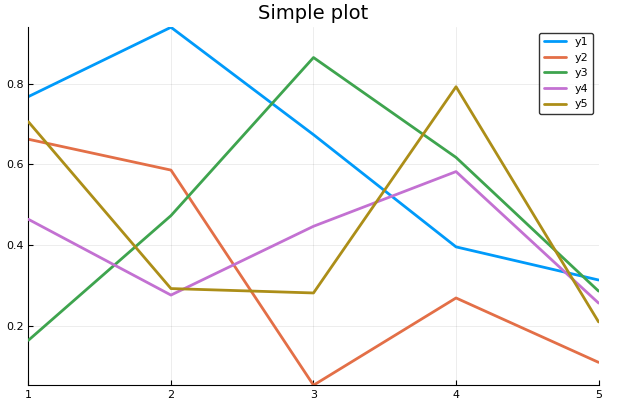
Again, the srand(123) command guarantees that any user who applies the same random seed will get the same set of random numbers. Because of this, he/she would get the same graph shown previously. ...

