The next example of running a linear regression and the related datasets could be downloaded at http://canisius.edu/~yany/data/c9_input.csv. In the following program, the input data set is assumed to be under c:/temp:
a=csvread("c:/temp/c9_input.csv");x=a(:,2);y=a(:,3);figure % open a window for graphplot(x, y, 'o');ylabel('Annual returns for S&P500')xlabel('Annual returns for IBM')
The first graph is shown here:
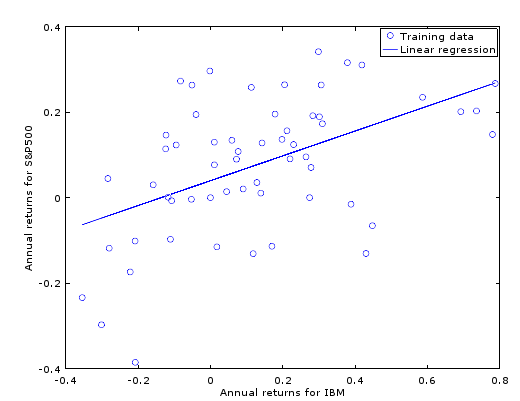
To save space, the long program will not be shown here. Interested readers can use the previous link. However, its output graph is shown instead:
For the next example, we download an Octave machine library ...

