The most widely used Python package for graphs and images is called matplotlib. The following program can be viewed as the simplest Python program to generate a graph since it has just three lines:
import matplotlib.pyplot as plt
plt.plot([2,3,8,12])
plt.show()
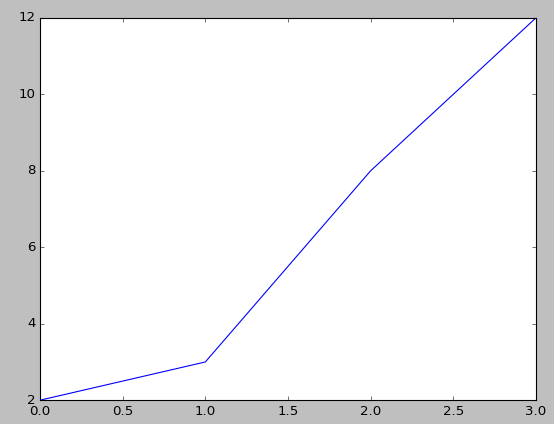
The first command line would upload a Python package called matplotlib.pyplot and rename it to plt.
Note that we could even use other short names, but it is conventional to use plt for the matplotlib package. The second line plots four points, while the last one concludes the whole process. The completed graph is shown here:
For the next example, we add ...

