Colour section plate captions
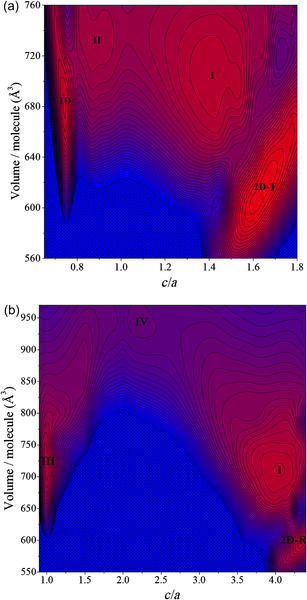
Plate I (Chapter 2) Contour plot of Ecoh along (a) the tetragonal and (b) the trigonal continuous path. Lighter (red) regions correspond to preferable structures (with higher Ecoh), while darker (blue) regions are less favourable. BCC and FCC lattices correspond to c/a = 1 and c/a = √2 (dashed lines), respectively. White dots represent maxima of the Ecoh, crossed regions have negative Ecoh, and the interval between lines is 0.05 eV. Labels I, II, 1D, and 2D-T refer to corresponding stable structures. Source: Adapted from Volonakis et al. (2013a); © IOP Publishing. Reproduced by permission of IOP Publishing. All rights ...
Get Handbook of Flexible Organic Electronics now with the O’Reilly learning platform.
O’Reilly members experience books, live events, courses curated by job role, and more from O’Reilly and nearly 200 top publishers.

