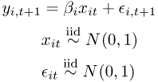
9.4 Monte Carlo Study
In our data-generating process (DGP), the cross-sectional dimension is N = 10, and the time-series dimension varies from S + P = 100 to 400. For each time-series length, estimation is performed over half of the sample and prediction over the second half so that S = P.
For example, the smallest sample size that we consider is of length 100. The first 50 observations are used to estimate the prediction model and the second 50 are reserved for forecast evaluation.
The DGP for our Monte Carlo work is as follows:
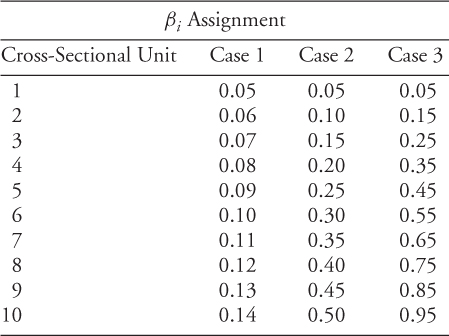
In terms of the slope heterogeneity, we consider the following three cases for assignment of the slope coefficients:
For each experiment, 2000 replications are performed. We compute the MSPE from the pooled regression forecasts, the time-series regression forecast, and the driftless random walk forecast. Our discussion is limited to these point estimates. Inference issues, while very important, are addressed in a separate chapter of this book (Della Corte and Tsiakas, 2010).3
Table 9.1 shows the MSPE comparison between the pooled and time-series forecasts. Bold entries indicate instances in which the MSPE of the pooled forecasts dominate those of the time-series forecasts. We observe two very striking features that corroborate the implications of the asymptotic ...
Get Handbook of Exchange Rates now with the O’Reilly learning platform.
O’Reilly members experience books, live events, courses curated by job role, and more from O’Reilly and nearly 200 top publishers.

