Section 21
Conversion
Figures
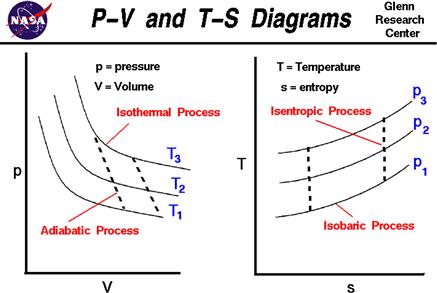
Figure 21.1 A simplified pressure-volume (P-V) and temperature-entropy (T-S). Adapted from United States National Aeronautics and Space Administration (NASA), P-V and S-T diagrams, <http://www.grc.nasa.gov/WWW/k-12/airplane/pvtsplot.html>.
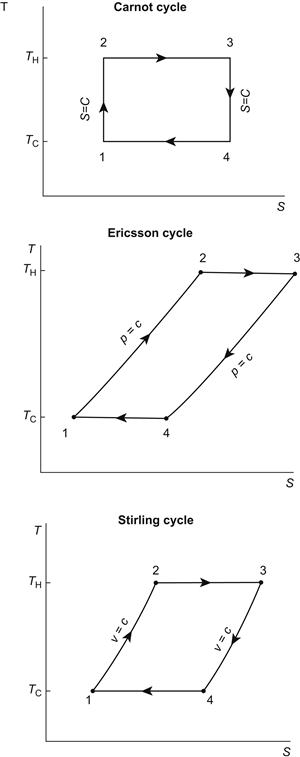
Figure 21.2 The Carnot, Ericsson, Stirling cycles. Source: Adapted from Moran, Michael J. 2005. Engineering Thermodynamics, In: Frank Kreith and D. Yogi Goswami, Editors. CRC Handbook of Mechanical Engineering, Second Edition (Boca Raton, CRC Press).
Figure 21.3 The Otto and Diesel ...
Get Handbook of Energy now with the O’Reilly learning platform.
O’Reilly members experience books, live events, courses curated by job role, and more from O’Reilly and nearly 200 top publishers.

