Section 9
Renewables
Charts
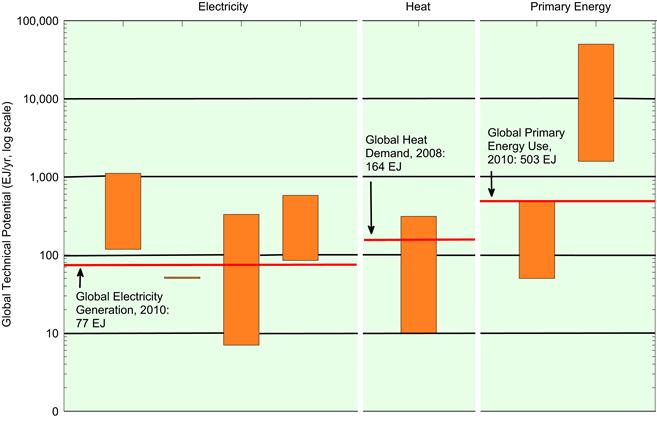
Chart 9.1 Range of global technical potentials of renewable sources. Source: Data from Moomaw, W., F. Yamba, M. Kamimoto, L. Maurice, J. Nyboer, K. Urama, T. Weir, 2011: Introduction. In IPCC Special Report on Renewable Energy Sources and Climate Change Mitigation [O. Edenhofer, R. Pichs-Madruga, Y. Sokona, K. Seyboth, P. Matschoss, S. Kadner, T. Zwickel, P. Eickemeier, G. Hansen, S. Schlömer, C.von Stechow (eds)], Cambridge University Press, Cambridge, United Kingdom and New York, NY, USA.
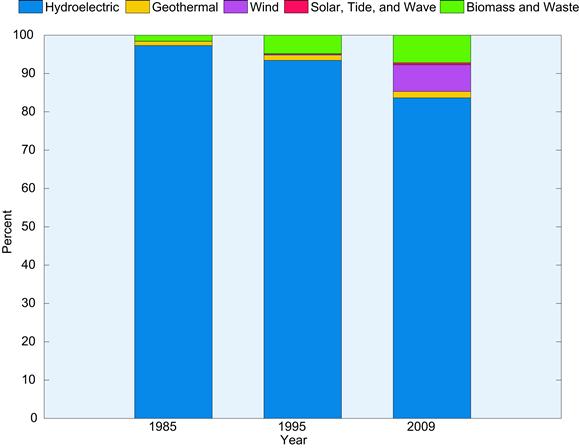
Chart 9.2 Net generation of ...
Get Handbook of Energy now with the O’Reilly learning platform.
O’Reilly members experience books, live events, courses curated by job role, and more from O’Reilly and nearly 200 top publishers.

