Table 19.2
Contingency Table Cross-Classifying Forecasts of A and Observations Y
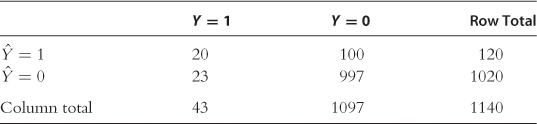
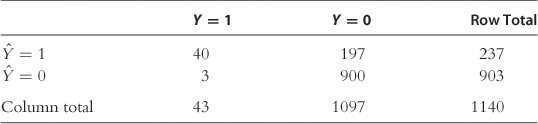
Table 19.3
Contingency Table Cross-Classifying Forecasts of B and Observations Y
Here A and B are ![]() binary point forecasts. If forecast skill is measured by the Brier score, then A performs better than B since its Brier score is about
binary point forecasts. If forecast skill is measured by the Brier score, then A performs better than B since its Brier score is about ![]() , less than B’s score of
, less than B’s score of
Get Handbook of Economic Forecasting now with the O’Reilly learning platform.
O’Reilly members experience books, live events, courses curated by job role, and more from O’Reilly and nearly 200 top publishers.

