Calculating Scatter plots using MapReduce
Another useful tool while analyzing data is a Scatter plot, which can be used to find the relationship between two measurements (dimensions). It plots the two dimensions against each other.
For example, this recipe analyzes the data to find the relationship between the size of the web pages and the number of hits received by the web page.
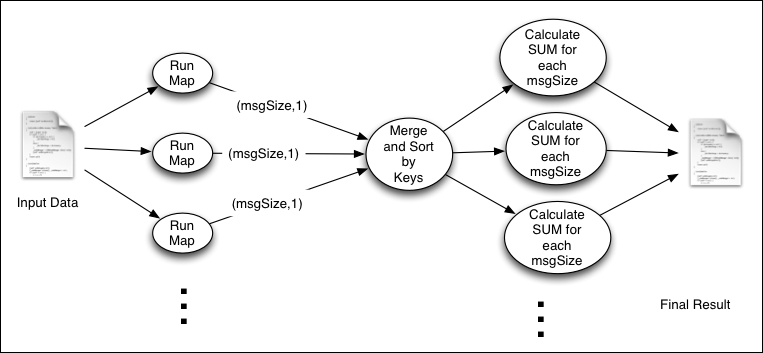
The following image shows the execution summary of this computation. Here, the map function calculates and emits the message size (rounded to 1024 bytes) as the key and one as the value. Then, the Reducer calculates the number of occurrences for each message size:
Getting ...
Get Hadoop MapReduce v2 Cookbook - Second Edition now with the O’Reilly learning platform.
O’Reilly members experience books, live events, courses curated by job role, and more from O’Reilly and nearly 200 top publishers.

