12.6. Drawing a Pie Chart
Do you remember the pie chart application from Chapter 3 (see Figure 3.43)? Now let’s write a similar application using ASP.NET. We will provide both fill and draw options.
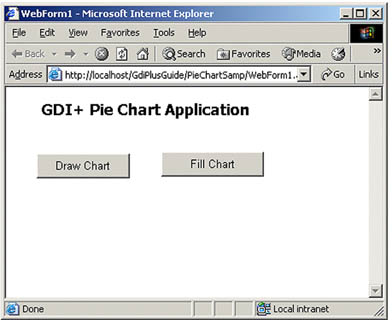
We create a Web Forms application using Visual Studio .NET. We add some text and two buttons to the page. The final Web page looks like Figure 12.16. The Draw Chart button will draw a pie chart, and the Fill Chart button will fill the chart with different colors.
Figure 12.16. A pie chart–drawing application in ASP.NET
Now we add some variables (see Listing 12.10). Instead of reading values from the user, we use hard-coded values for the valArray ...
Get Graphics Programming with GDI+ now with the O’Reilly learning platform.
O’Reilly members experience books, live events, courses curated by job role, and more from O’Reilly and nearly 200 top publishers.

