Part 2 Process and Tools
The goal of this part of the book is to outline all the steps involved in taking raw data and transforming it into an insightful, interactive analysis of a graph data set. Various examples will be used throughout this sectionâsuch as the graph of people associated with 10,000 e-mails shown in Figure P2-1.
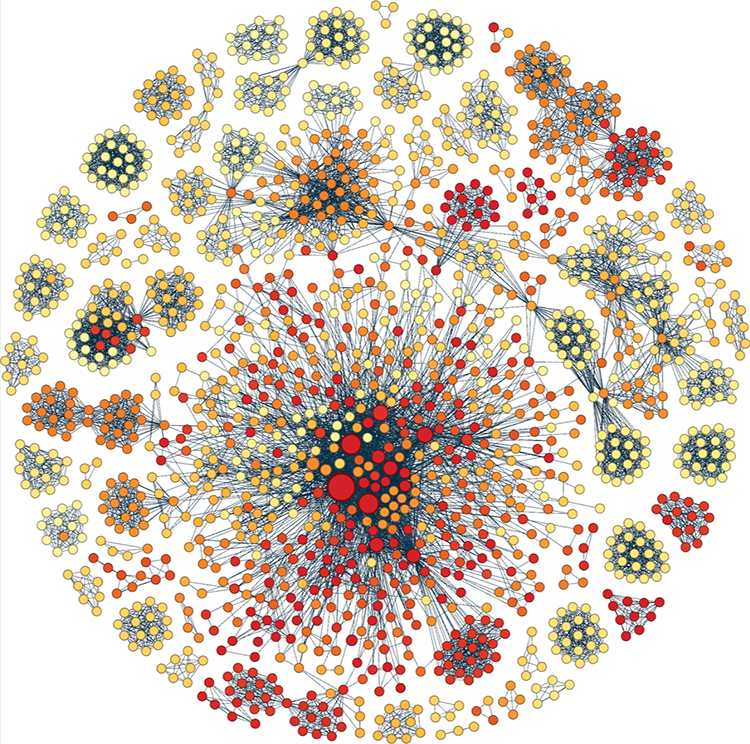
Figure P2-1: Graph of people connected through 10,000 e-mail messages
Whether you are exploring e-mails, tweets, market baskets, Internet networks, flight networks, or global trade flows, you usually follow a sequence of steps, as well as use various tools, to transform data into insights through analysis and visualizations.
Process
Table P2-1 provides an overview of the next six chapters. Chapter 3 (âDataâCollect, Clean, and Connectâ), Chapter 4 (âStats and Layoutâ), Chapter 5 (âVisual Attributesâ), and Chapter 6 (âExplore and Explainâ) walk you through the major steps, starting from data through to communicating results. Chapter 7 (âPoint-and-Click Graph Toolsâ) and Chapter 8 (âLightweight Programming) discuss how this is accomplished using either point-and-click graph software or programming.
Table P2-1: Process of Visualization
| Step | Example | Description |
| Data (Chapter 3) | 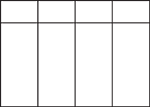
| Collect and clean the data. Then prepare it ... |
Get Graph Analysis and Visualization: Discovering Business Opportunity in Linked Data now with the O’Reilly learning platform.
O’Reilly members experience books, live events, courses curated by job role, and more from O’Reilly and nearly 200 top publishers.

