Softening the axes
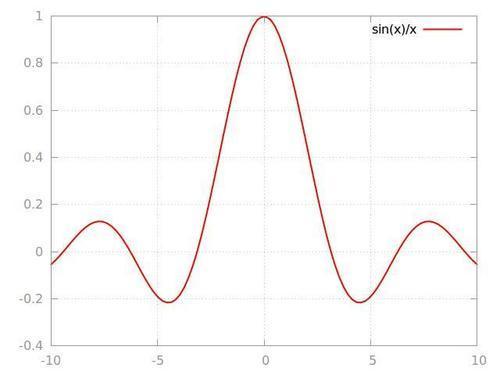
The default gnuplot style gives roughly equal visual prominence to both the axes and tics and to the actual curves being plotted. Some may prefer the aesthetic properties of the style of plot illustrated in the following figure. In this graph, the curve is made to stand out by rendering the tics labels, border, and background grid in a lighter shade and using a thicker line for the curve:
How to do it…
Load the following script into gnuplot to see the result:
set style line 2 lc rgb '#999999' lt 0 #grid
set style line 1 lc rgb '#999999' lt 1 #border
set grid linestyle 2
set border linestyle 1
plot sin(x)/x lw 2
How it works…
The
Get gnuplot Cookbook now with the O’Reilly learning platform.
O’Reilly members experience books, live events, courses curated by job role, and more from O’Reilly and nearly 200 top publishers.

