Plotting labels from files
In Chapter 2, Annotating with Labels and Legends, we learned how to place a text label anywhere on the graph with the set label command. It is also possible to plot a set of labels whose text, positions, and possibly other attributes are derived from the information in a datafile. In this way, we can create visualizations such as the following:
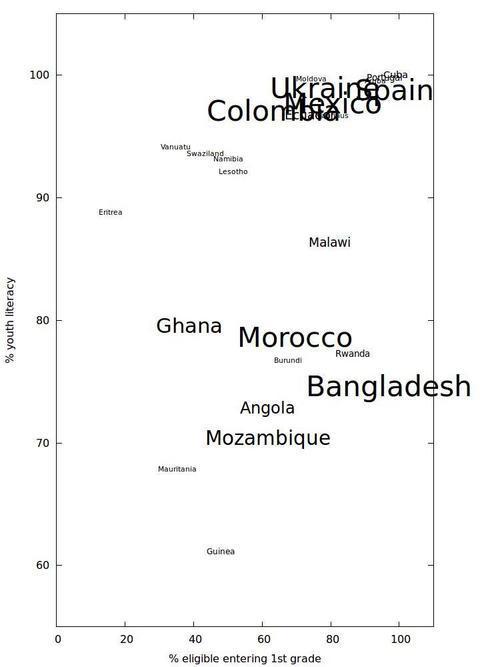
The previous figure shows a collection of names of countries printed with a text size that is proportional to each country's population (aside from the practical requirement to impose a maximum and minimum font size). The labels are positioned to indicate each country's school intake ...
Get gnuplot Cookbook now with the O’Reilly learning platform.
O’Reilly members experience books, live events, courses curated by job role, and more from O’Reilly and nearly 200 top publishers.

