Combining surfaces with images
It is possible to plot a surface and its projection as a color image on the x-y plane on the same graph. The two simultaneous views of the same data or function can be useful to bring out the topography of a complex surface.
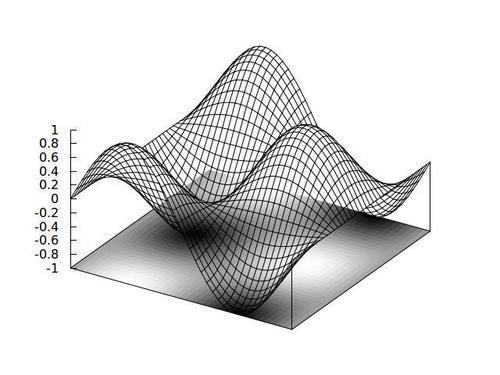
The previous figure shows a simple trigonometric function of two variables displayed as a surface with its values simultaneously encoded into colors (or gray values) at the base of the plot.
How to do it…
The following script produces the previous figure as its output:
set iso 40
set samp 40
unset key
set xrange [-pi:pi]
set yrange [-pi:pi]
f(x,y) = sin(x)*cos(y)
set hidden front
set xyplane at -1 ...
Get gnuplot Cookbook now with the O’Reilly learning platform.
O’Reilly members experience books, live events, courses curated by job role, and more from O’Reilly and nearly 200 top publishers.

