Combining contours and images
Sometimes we would like to plot two related but different sets of data on the same graph. In the case of 2D plots, it's simple: we just plot any number of curves and identify them with labels or a legend. But with 3D plots, trying to interpret a graph containing two different surfaces or sets of contours would be difficult, and plotting two heat maps simultaneously would not make any sense.
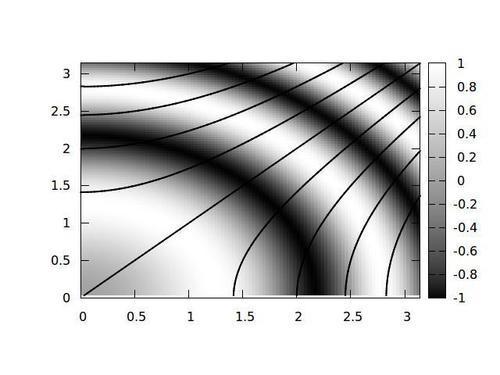
The previous figure shows one way to do this: plot contours and an image map together.
How to do it…
Feed this code to gnuplot to get the previous figure:
set xrange [0:pi] set yrange [0:pi] set iso 100 set samp 100 set cntrparam levels ...
Get gnuplot Cookbook now with the O’Reilly learning platform.
O’Reilly members experience books, live events, courses curated by job role, and more from O’Reilly and nearly 200 top publishers.

