Making an image plot or heat map
The information that is presented in a planar contour plot can also be conveyed by coloring or shading the x-y plane, rather than by drawing contours on it. The resulting graph is called an image plot, or sometimes, a heat map:
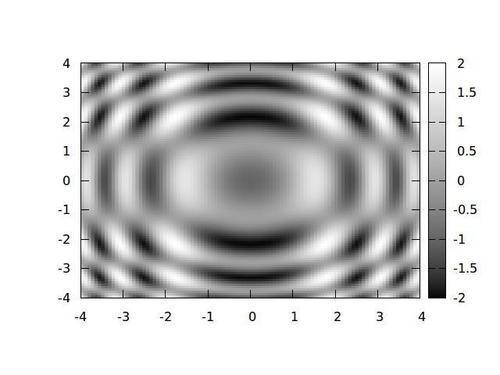
Depending on the character of the data to be plotted and the features one wants to call attention to, and to some extent the physical characteristics of the output device, either a contour plot or an image plot might be preferred.
How to do it…
The previous figure was created using the following script:
set xrange [-4:4] set yrange [-4:4] set iso 100 set samp 100 unset key unset sur set view ...
Get gnuplot Cookbook now with the O’Reilly learning platform.
O’Reilly members experience books, live events, courses curated by job role, and more from O’Reilly and nearly 200 top publishers.

