Making a contour plot
A contour plot is a set of isolines, or curves where the function or data has a constant value, drawn in the plane of the independent variables (x and y in Cartesian coordinates). It is simpler than the surface plots covered in the previous recipes in that it doesn't require the interpretation of perspective or hidden line removal. As there is no z axis for reference, the value that each isoline represents is represented by an individual label or by giving each line its own dash pattern or color.
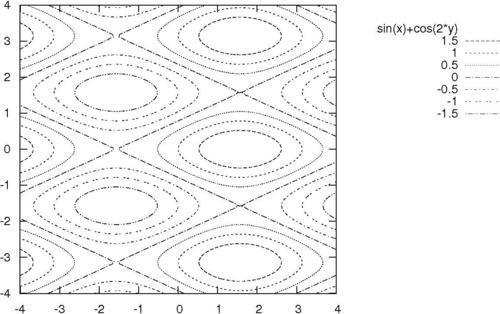
Certain types of patterns are better represented as surfaces, while for others, contours bring out more of the relevant characteristics. ...
Get gnuplot Cookbook now with the O’Reilly learning platform.
O’Reilly members experience books, live events, courses curated by job role, and more from O’Reilly and nearly 200 top publishers.

