Making a surface plot
A surface plot represents the dependent quantity z, which depends on the two independent variables x and y, as a surface whose height indicates the value of z.
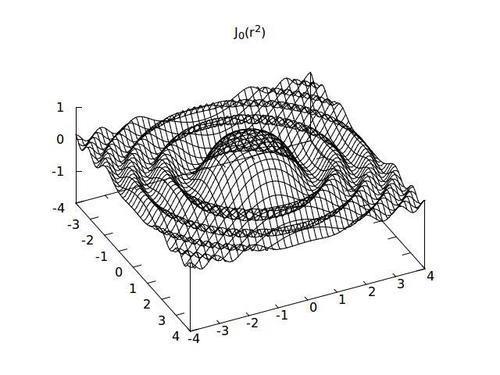
The previous figure is a perspective drawing of a surface representing the Bessel function J0(r), where r is the distance from (x=0, y=0). The height of the surface shows the value of J0, given on the vertical axis (unlabeled in this figure, but usually called z). The other
two (unlabeled) axes defining the plane above which the surface is drawn are the x and y axes.
How to do it…
The following code listing is the script that coaxed gnuplot into making the previous figure: ...
Get gnuplot Cookbook now with the O’Reilly learning platform.
O’Reilly members experience books, live events, courses curated by job role, and more from O’Reilly and nearly 200 top publishers.

