Multiplotting with labels and arrows
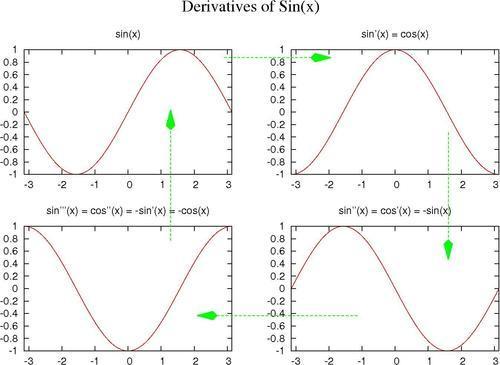
In this recipe, we show how to create a complete illustration that might be useful in a calculus textbook, using arrows and the screen coordinate system to lead the eye around a cycle of graphs. The following figure shows what happens when we take successive derivatives of a sine wave:
How to do it…
The following script will give you the previous figure:
set xrange [-pi:pi]
unset key
set multiplot layout 2,2 title "Derivatives of Sin(x)" font "Times-Roman, 22"
set style arrow 1 head filled size screen 0.03,15,135 lt 2 lw 2 set arrow 1 from screen .45, .84 to screen .65, .84 arrowstyle 1 set arrow 2 from screen .87, ...
Get gnuplot Cookbook now with the O’Reilly learning platform.
O’Reilly members experience books, live events, courses curated by job role, and more from O’Reilly and nearly 200 top publishers.

