Arranging an array of plots
The simplest use of the multiplot mode creates a rectangular array of plots with regular spacing. The following figure is an example of this type of multiple plot:
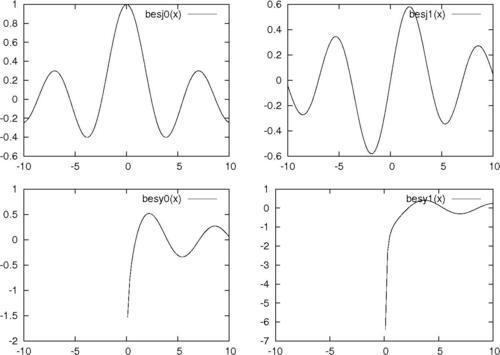
In the previous figure, we have made a table of graphs showing the four kinds of Bessel function that gnuplot has built in.
How to do it…
Run this script through gnuplot to get the array of plots shown in the previous figure:
set multiplot layout 2, 2
plot besj0(x)
plot besj1(x)
plot besy0(x)
plot besy1(x)
unset multiplot
How it works…
The new command is in the first line of the recipe. The commands following that are simple plot statements, until we reach the final ...
Get gnuplot Cookbook now with the O’Reilly learning platform.
O’Reilly members experience books, live events, courses curated by job role, and more from O’Reilly and nearly 200 top publishers.

