Coloring your curves
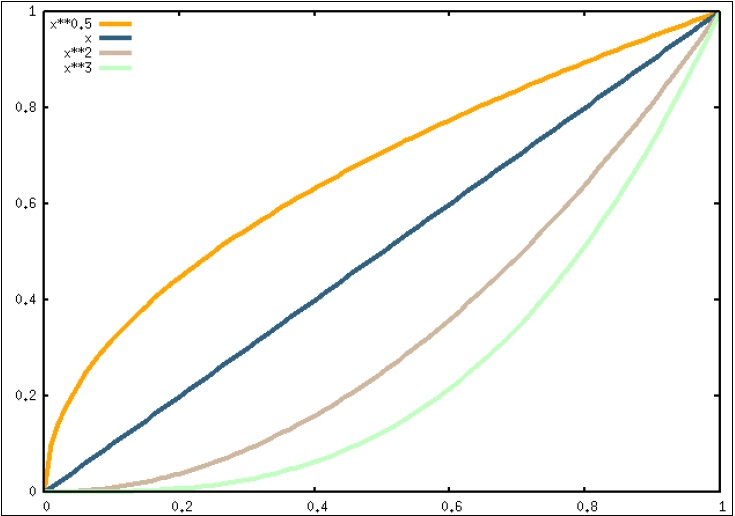
The following figure is a simple graph of different powers of x, color-coded. The colors, which can be seen in the electronic version of the graph, appear here as different shades of gray:
How to do it…
To produce the previous figure, enter the following sequence of commands at the gnuplot interactive prompt. Alternatively, save them in a file and use the command gnuplot --persist <file>, substituting your filename for <file>. The --persist flag tells gnuplot to keep the plot window open after executing the script. (This script, as well as all the others, are provided with this book as a file named after the recipe.)
set term x11 ...
Get gnuplot Cookbook now with the O’Reilly learning platform.
O’Reilly members experience books, live events, courses curated by job role, and more from O’Reilly and nearly 200 top publishers.

