Labeling the axes
In this recipe, we add labels to our axes to explain what is being plotted and the significance of the tics and numerical scales. We also add an overall title that will appear at the top of the graph.
Getting ready
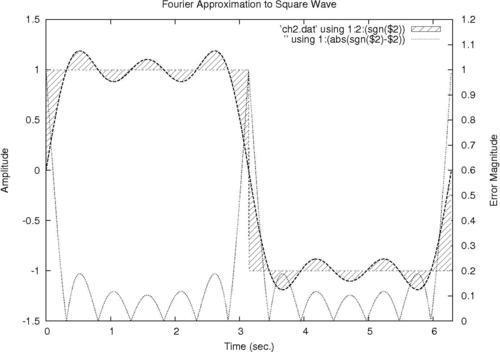
Make sure the supplied datafile ch2.dat is in your current directory. It is the result of adding the first three terms in the Fourier series approximation to the square wave. It is not important to understand what that means to follow the gnuplot recipes; we are using this file because it leads to a good graph for the purpose of illustrating annotations and labeling.
How to do it…
Following is the script that produces the ...
Get gnuplot Cookbook now with the O’Reilly learning platform.
O’Reilly members experience books, live events, courses curated by job role, and more from O’Reilly and nearly 200 top publishers.

