Graphing parametric curves
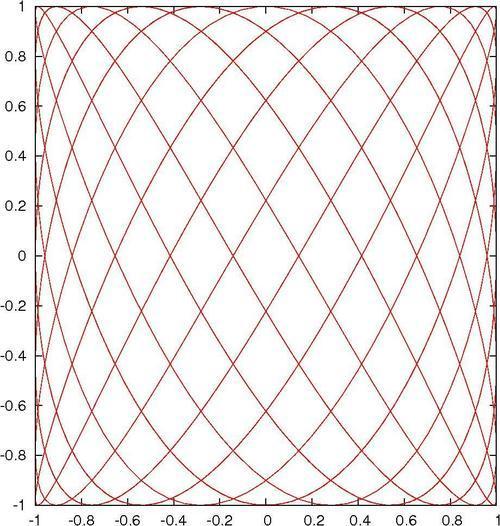
Gnuplot can graph functions whose x and y values depend on a third variable, called a parameter. In this way, more complicated curves can be drawn. The following plot resembles a lissajous figure, which can be seen on an oscilloscope when sine waves of different frequencies are controlling the x and y axes:
How to do it…
The following script creates the previous figure:
set samples 1000
set parametric
plot sin(7*t), cos(11*t) notitle
How it works…
We want more samples than the default 100 for a smoother plot, hence the first line. The second line (highlighted) changes the way gnuplot interprets plot commands; now the two functions ...
Get gnuplot Cookbook now with the O’Reilly learning platform.
O’Reilly members experience books, live events, courses curated by job role, and more from O’Reilly and nearly 200 top publishers.

