Dealing with errors
Along with data often comes error, uncertainty, or the general concept of a range of values associated with each plotted value. To express this in a plot, various conventions can be used; one of these is the "error bar", for which gnuplot has some special styles. The following figure shows an example of an error bar:
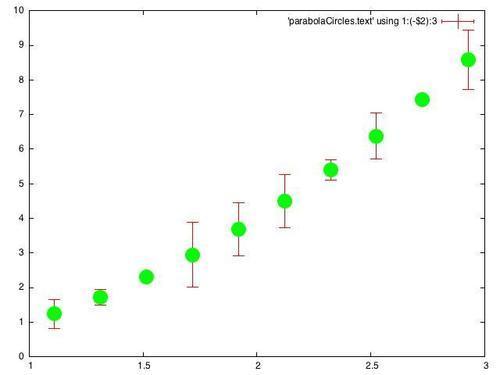
The previous figure has the same data that we used in our previous recipe, Plotting circles, plotted over a restricted range, and using the random number column to supply "errors", which are depicted here as vertical lines with small horizontal caps.
Getting ready
Keep the datafile parabolaCircles.text ready again. ...
Get gnuplot Cookbook now with the O’Reilly learning platform.
O’Reilly members experience books, live events, courses curated by job role, and more from O’Reilly and nearly 200 top publishers.

