Stacking histograms
A more interesting type of histogram plot shows the distribution of some quantity with a second distribution stacked on top. This provides a quick way to visually compare two distributions. The values of the second distribution are measured not from the axis, but from the top of the box showing the first distribution. The following figure shows a stacking histogram:
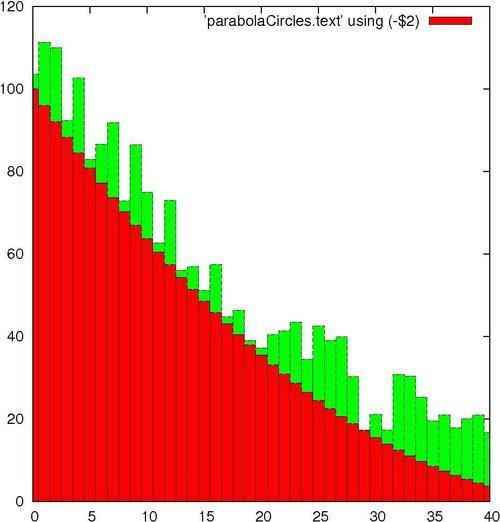
You might have noticed that the information printed in the legend on the upper-right corner is not very descriptive. This is the default; in the next chapter, you will learn how to change it to whatever you want.
Getting ready
We are going to reuse our datafile parabolaCircles.text ...
Get gnuplot Cookbook now with the O’Reilly learning platform.
O’Reilly members experience books, live events, courses curated by job role, and more from O’Reilly and nearly 200 top publishers.

