Making a basic histogram plot
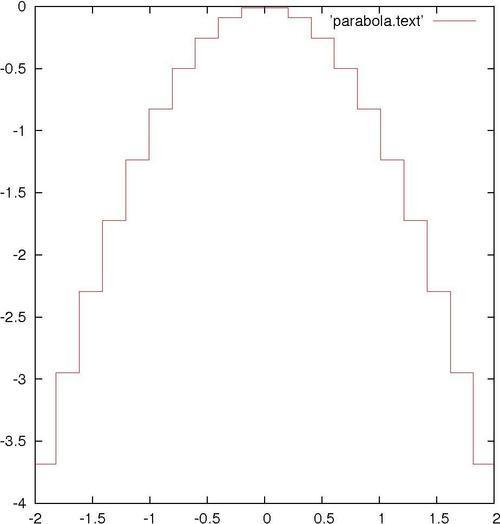
This recipe shows you how to make the simplest step-type histogram. Later, we will build histogram and statistical plots on this, but sometimes this is all you need. The following figure shows a simple step-type histogram:
Getting ready
We're going to plot a part of our file parabola.text, so make sure that's still available. Of course, if you have your own sorted statistical data that will probably be more interesting.
How to do it…
Type the following command to make a histogram plot:
plot [-2:2] 'parabola.text' with histeps
How it works…
As we can see, rather than drawing a line through a series of x-y points, the histeps ...
Get gnuplot Cookbook now with the O’Reilly learning platform.
O’Reilly members experience books, live events, courses curated by job role, and more from O’Reilly and nearly 200 top publishers.

