Plotting boxes
Gnuplot's box style is similar to a bar chart, with each value plotted as a box extending up from the axis. You can have the boxes filled with patterns, solid colors, or leave them empty.
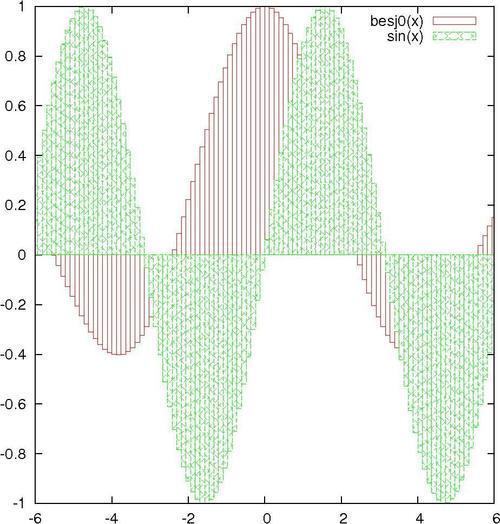
This style is commonly used either as a type of histogram (covered later in this chapter) or as a way to compare a set of disparate items. The following figure plots boxes using the fill pattern:
How to do it…
It just takes the following script to get the previous figure:
set style fill pattern
plot [-6:6]  besj0(x) with boxes, sin(x) with boxes
How it works…
The first command tells gnuplot to fill the boxes with a fill pattern, cycling through the patterns ...
Get gnuplot Cookbook now with the O’Reilly learning platform.
O’Reilly members experience books, live events, courses curated by job role, and more from O’Reilly and nearly 200 top publishers.

